

Global Warming Watch: Groundwater Use tied to Sea Level Rise and Tilting of Earth's Axis
Global Warming Watch: Groundwater Use tied to Sea Level Rise and Tilting of Earth's Axis
A new study, again, shows significant flaws in 'da Science™', which leads to the question: did the Scientific Revolution end in the late 20th century?

Another day, another ‘study’ has been pushed across legacy media. In this particular case, this trip down the rabbit hole commenced on the day of the summer solstice (21 June), when Austrian state-broadcaster ORF ran yet another alarmist piece on ‘Climate Change’.
As is often the case in German-language legacy media, the article, entitled ‘Groundwater Depletion Moves North Pole’ (orig. ‘Grundwasserentnahme verschiebt Nordpol’), is a rip-off of someone else’s work. Basically, ‘doing journalism’ these days often means reading someone else’s work, translating it, and adding some typically ideologically biased bells and whistles. The linked piece is no exception, but at least ORF added links to the original materials.
In this particular instance, ORF more or less verbatim copied a piece that appeared two days earlier in Spektrum der Wissenschaft, a popular science magazine.
Both articles, however, had the same ‘common ancestor’, so to speak, which is an article that appeared in Nature on 16 June. Written by David Castelvecchi, it bears the title ‘Rampant groundwater pumping has changed the tilt of Earth’s axis’ and makes for a wonderful example of what passes for ‘doing Science’ these days. Basically, it’s a few hundreds of words summarising the main findings of a new study (which I’ll get to in due course), and I shall quote it here in full (reference omitted, emphases mine):
Human depletion of underground reservoirs has shifted the global distribution of water so much that the North Pole has drifted by more than 4 centimetres per year.
The Earth has lost enough groundwater to thirsty humans to measurably tilt the planet’s axis of rotation. [oh my, drinking contributes to ‘Climate Change’]
The net water lost from underground reservoirs between 1993 and 2010 is estimated to be more than 2 trillion tonnes. That has caused the geographic North Pole to shift at a speed of 4.36 centimetres per year, researchers have calculated. The results appeared on 15 June in Geophysical Research Letters.
A wobbling of the Earth
The tilt of the axis on which any celestial object spins tends to be stable. But small changes can occur when large masses shift location inside a planet and on its surface. ‘Every mass moving around on the surface of the Earth can change the rotation axis’, says Ki-Weon Seo, a geophysicist at Seoul National University.
Astronomers can track such motions in the Earth’s axis by observing quasars, the bright centres of distant galaxies that constitute practically immobile points of reference. The largest axis change is seasonal and is triggered by the motion of atmospheric masses as the weather and seasons change. This effect causes the Earth’s geographic poles to wobble by up to several metres every year.
Shifts in water masses can cause smaller but still measurable changes in the tilt of Earth’s axis. Until recently, researchers thought that these water-driven effects would be caused mainly by the melting of glaciers and ice caps. But when Seo and his collaborators tried to model the Earth’s water content to account for how much the axis has tilted, they could not fully explain the data. Adding the effects of changes in surface reservoirs did not help, says Seo, ‘so I just scratched my head and said, “probably one effect is groundwater”’. [could be, it’s a nice hypothesis—or speculation—as Mr. Seo was trying to find an explanation for data he couldn’t explain otherwise]
Gravitational surveys have measured the depletion of underground reservoirs, which is caused in large part by irrigation, especially in northwestern India and western North America. These surveys show that groundwater pumping shifted enough mass into the oceans to cause 6.24 millimetres of global sea-level rise between 1993 and 2010. [oh my, 6.24mm in 27 years corresponds to approx. 0.23mm per year; of more concern is the disconnect between the previous paragraph—’they could not fully explain the data’—to the iron-clad certainty here, as ‘surveys show that groundwater pumping…cause[d] 6.24mm of global sea-level rise]
By including these changes in their model, the authors calculated that they should have a substantial impact on the Earth’s rotation axis. They predicted that the displacement of groundwater alone causes a shift in the North Pole of 4.36 centimetres per year, roughly in the direction of Russia’s Novaya Zemlya islands.
The research ‘distills the magnitude of groundwater extraction across the globe to a significant, relatable metric’, says Allegra LeGrande, a climate scientist at the NASA Goddard Institute for Space Studies in New York City. Seeing yet another global impact of people on the world, she says, gives her a sense of ‘grief and awe’. [it’s always wonderful to conclude on a high note, esp. as Ms. LeGrande’s feelings and emotions are certainly relevant to the scientific enquiry into groundwater pumping…]
I highlighted the sleight-of-hand in the piece, but it bears repeating: in one paragraph, the study’s lead or corresponding author states that he is, in effect, hypothesising (speculating) about the best way to interpret the findings—and in the next paragraph, Mr. Castelvecchi uses unambiguous language to dispel any residual doubt the casual reader may have.
Needless to say, both Spektrum and ORF (and I’m sure other legacy media outlets that have picked up this story, too) do not concern themselves with these…’particularities’.
With that background, it is now time to actually look at the study itself.
Doing Science in the 21st Century
The study in question is Seo et al., ‘Drift of Earth's Pole Confirms Groundwater Depletion as a Significant Contributor to Global Sea Level Rise 1993–2010’, which appeared in Geophysical Research Letters (https://doi.org/10.1029/2023GL103509) on 15 June 2023. It is fully ‘open access’ and you can read it yourself by clicking on the link. For readability purposes, I have removed all references; all emphases and commentary in squared parentheses mine.
Abstract
Climate model estimates show significant groundwater depletion during the 20th century, consistent with global mean sea level (GMSL) budget analysis. However, prior to the Argo float era, in the early 2000’s, there is little information about steric sea level contributions to GMSL [information about Argo], making the role of groundwater depletion in this period less certain. We show that a useful constraint is found in observed polar motion (PM). In the period 1993–2010, we find that predicted PM excitation trends estimated from various sources of surface mass loads and the estimated glacial isostatic adjustment agree very well with the observed. Among many contributors to the PM excitation trend, groundwater storage changes are estimated to be the second largest (4.36 cm/yr) toward 64.16°E. Neglecting groundwater effects, the predicted trend differs significantly from the observed. PM observations may also provide a tool for studying historical continental scale water storage variations.
Do note the study period 1993-2010 means that roughly half of it contains ‘data’ inputs considered to be of ‘little information’.
Plain Language Summary
Melting of polar ice sheets and mountain glaciers has been understood as a main cause of sea level rise associated with contemporary climate warming. It has been proposed that an important anthropogenic contribution is sea level rise due to groundwater depletion resulting from irrigation. A climate model estimate for the period 1993–2010 gives total groundwater depletion of 2,150 GTon, equivalent to global sea level rise of 6.24 mm. However, direct observational evidence supporting this estimate has been lacking. In this study, we show that the model estimate of water redistribution from aquifers to the oceans would result in a drift of Earth’s rotational pole, about 78.48 cm toward 64.16°E. In combination with other well-understood sources of water redistribution, such as melting of polar ice sheets and mountain glaciers, good agreement with PM observations serves as an independent confirmation of the groundwater depletion model estimate.
Here, we note that there is a constant—the assumption of anthropogenic (i.e., human-made) ‘contribution’ to sea level rise. Moreover, note the dual speculative nature of the paper as Seo et al. use a climate model for the period 1993-2010 (which is partially based on ‘little information’, as explained above) that lacks ‘direct observational evidence’; they then built their own model whose assumptions, if true, ‘would result in a drift of Earth’s rotational pole’. Yet, I maintain that two hypotheticals don’t make one scientific fact.
In their introduction, the Seo et al. explain several data inputs, and we note that both NASA’s GRACE missions (which originally ran from 2002-17, with a follow-up mission commencing in 2018) and the Argo Floats (operational since 2000) do not offer data for the period before the 21st century:
Prior to the GRACE mission, limited in situ and remote sensing data indicated that increasing storage in artificial reservoirs behind dams was a source of GMSL decrease, while melting ice from AIS, GrIS and mountain glaciers contributed to GMSL rise. Groundwater depletion simulated by climate models has been identified as a significant contributor to GMSL rise during the 20th century, but the limited availability of in situ or remote sensing groundwater data has left observational evidence lacking. Alternatively, the contribution of groundwater depletion to GMSL has been understood by examining time series of altimetric observations of GMSL. For example, Dieng et al. (2017) compared the observed GMSL rate and an estimated rate obtained from all known contributions to GMSL including anthropogenic sources (dam and groundwater effects) with a rate of 0.12 mm/yr for 1993–2015. Considering the effect of GMSL decrease due to impounding water behind dams, a positive GMSL contribution from anthropogenic effects is mostly associated with groundwater depletion (Chao et al., 2008). Agreement between observed and estimated GMSL rates provides evidence of global groundwater depletion and GMSL rise. However, analysis ought to include steric sea level changes which are highly uncertain prior to the Argo float era, beginning in 2005, when measurements for estimating steric effects to 2,000-m depth became available showed that in the period 1993–2015, steric contributions to GMSL rise were in the range 0.90–1.70 mm/yr, a range that exceeds the likely groundwater contribution of ∼0.30 mm/yr.
Moving on to data inputs, we get more information about the paper:
This study reviews the budget of GMSL [by which is meant changes over time in ocean mass + ocean thermal expansion and salinity to sea level change, according to Dieng et al. 20171] in the period 1993–2010 using data and models for various hydrologic sources. We use associated PM predictions and observations to understand groundwater depletion estimates from a climate model. The study period was selected considering availability of both observations and model estimates…
Two different estimates are available during the study period…
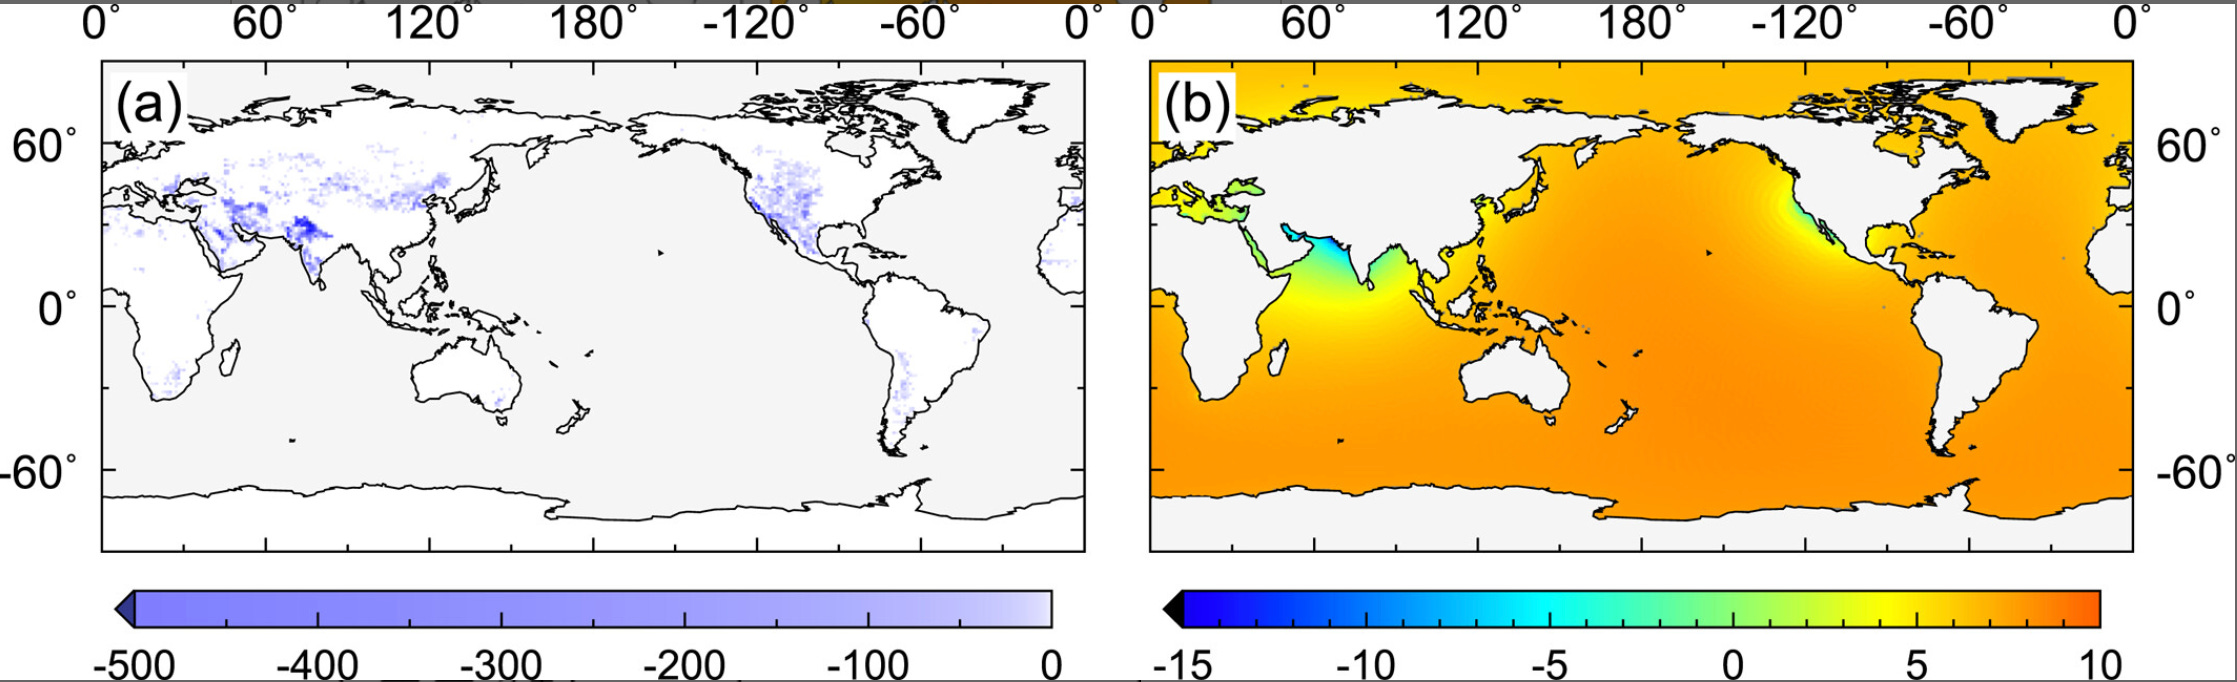
Using terrestrial water and ice mass change data described above, sea level variations were estimated based on mass conservation between land and oceans considering self-attraction and loading (SAL) effects…Northwestern India and western North America show significant decreases in groundwater storage (Figure 2a). Most of the world’s oceans experience an increase of near 10 mm, but a sea level drop over the Indian and the Pacific Ocean adjacent to regions of groundwater depletion (Figure 2b) is a consequence of SAL that causes sea level to decrease near regions of diminished water mass on land.
I am reproducing Figures 2a and 2b here to show that the described anomalies are not, exactly, very subtle:
Results
We first compare time series of PM excitation (x1, x2) from observations with estimates from all known sources of PM excitations…Because we considered two estimates of polar ice sheet contributions, and three for mountain glaciers, six different estimates of (x1, x2) are possible for each GIA PM estimate…[here I have omitted the technical details related to accounting for all possible confounding variables, such as barometric pressure, ocean bottom pressure, winds, and currents] Most high frequency variations in (x1, x2) are explained by changes in barometric pressure, ocean bottom pressure, winds and currents. PM excitation variations associated with ice mass loss from mountain glaciers and Greenland show directional changes in PM excitation similar to previous studies around 1998 and 2005, respectively.
In plain language: we have added bells and whistles, used some more data—and confirmed what was known about polar drift 25 years ago.
Yet, a bit further down, Seo et al. also relate this:
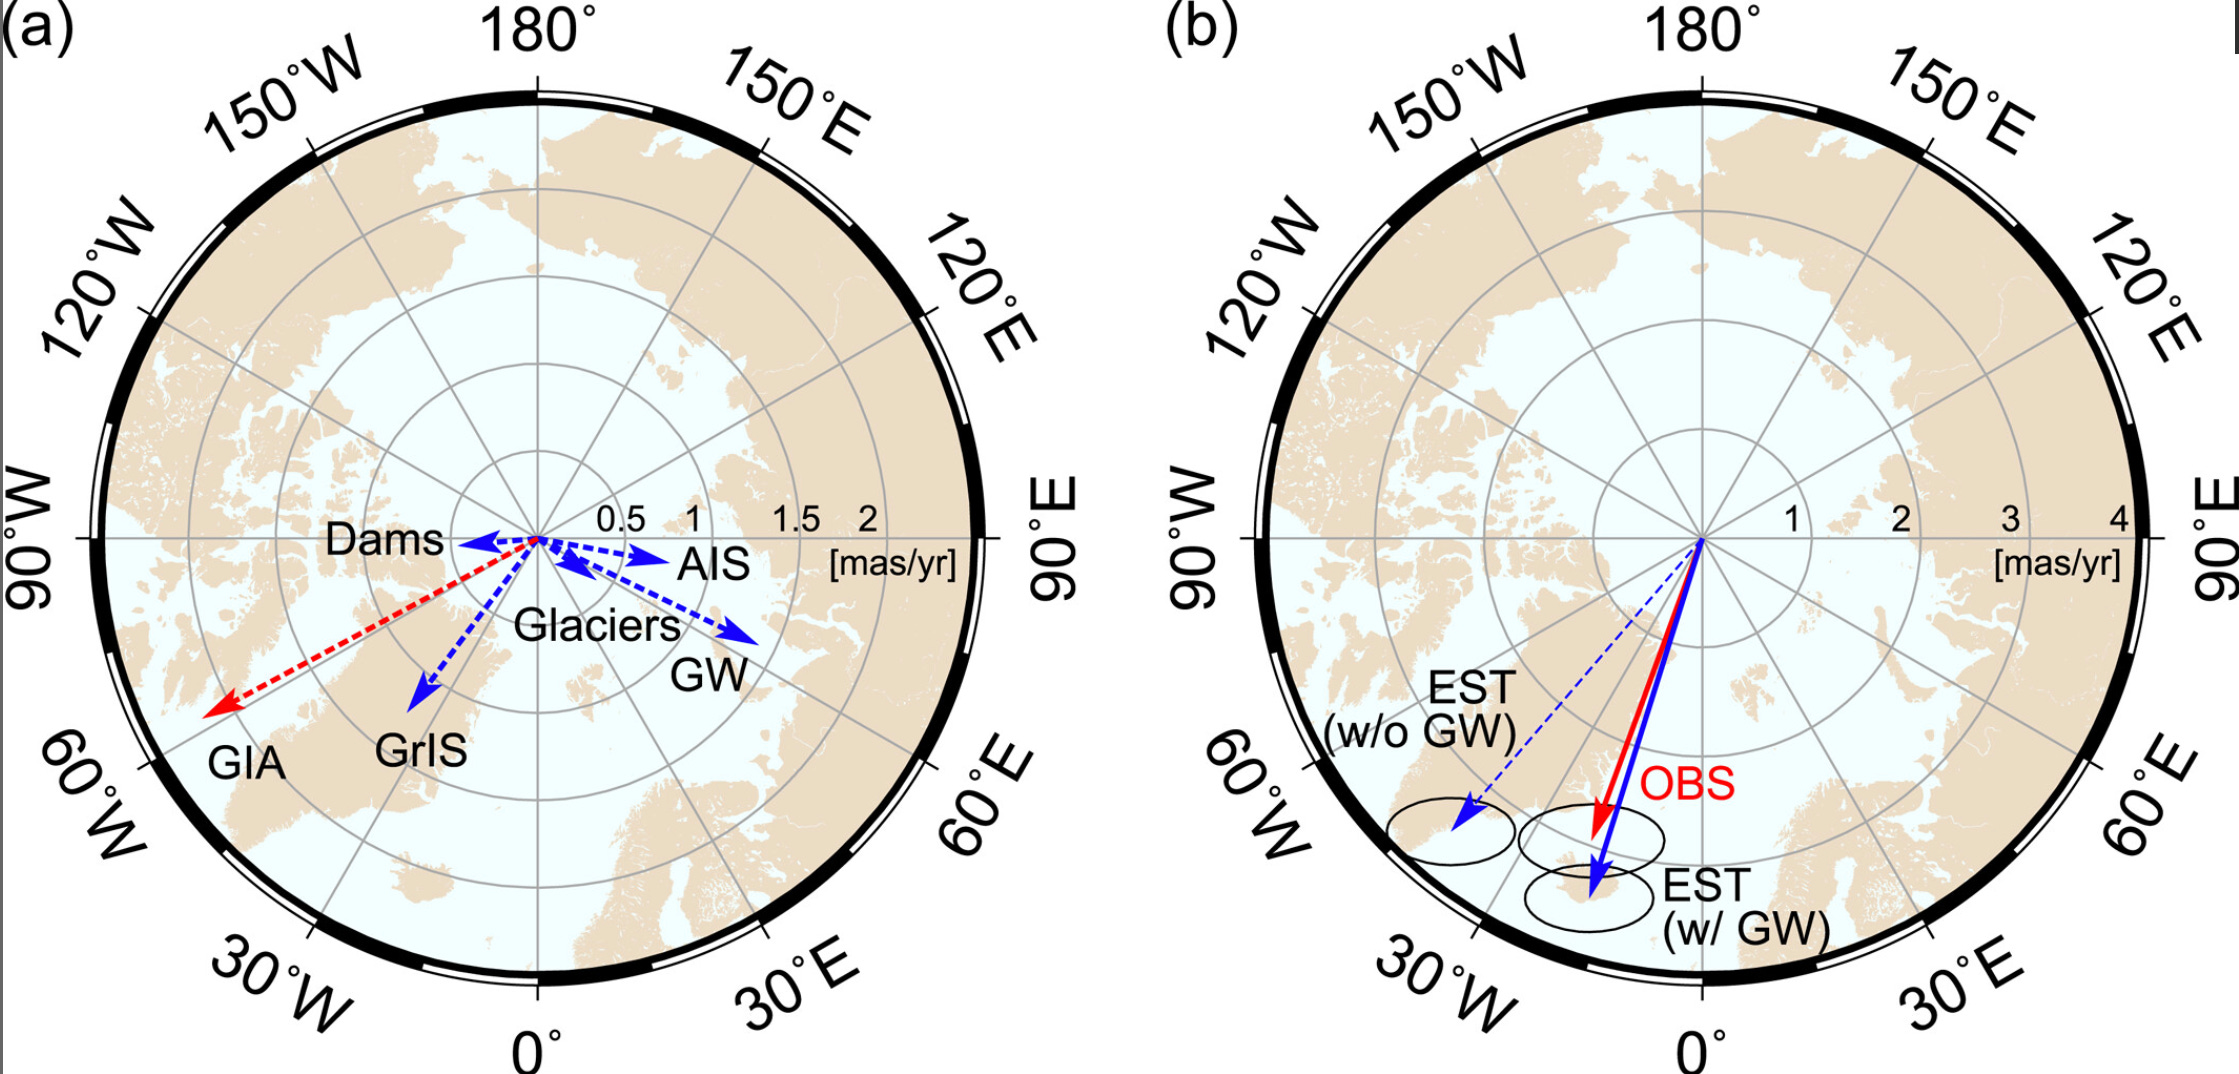
The importance of groundwater contributions to the rise in GMSL from 1993 to 2010 can be seen more clearly in a polar plot (Figure 4), which shows both magnitude and direction of trends…Minor contributions to (x1, x2) trends from soil moisture, barometric pressure, ocean bottom pressure, winds and currents are not included [remember: ‘Most high frequency variations in (x1, x2) are explained’ by precisely these factors] The red arrow shows GIA [glacial isostatic adjustment, which is science-speak for a set of assumptions about solid ice; details here; note that these models are not without problems, such as the assumption of glaciers resting on solid ground; these and other factors contribute to ‘uncertainty’, which is a feature of all these model/estimate inputs; this was recently explored by Simon and Riva 2020] PM moving toward the west coast of Greenland at a rate of 6.74 cm/yr (Seo et al., 2021). Figure 4 shows that groundwater depletion is the second largest contributor to the trend in PM excitation. Figure 4b compares observed (red) and estimated (blue) PM excitation trends. The estimated PM excitation trend is the vector sum of all arrows in Figure 4a, additionally including effects of soil moisture, barometric pressure, ocean bottom pressure, winds and currents. Ellipses represent PM excitation rate uncertainties estimated from the sum of squared formal errors in trend estimates at a 95% confidence level. The solid blue and dashed arrows show PM excitation estimates with and without groundwater, respectively. Excluding groundwater, estimated and observed PM excitation trends do not agree well. The difference is greatly reduced when groundwater is included. Observed GMSL rate from multiple satellite altimetry is also closely explained when including groundwater depletion data (see Figure S2 in Supporting Information S1).
In their discussion, Seo et al. also explain the limitations of their study (which is not the term used to describe them):
Storage changes in natural lakes, not considered here, would be a non-negligible source of GMSL and/or PM variations. However, the high variability of many lake levels leaves their contribution to the long-term GMSL trend uncertain. Another difficulty is the lack of a global database for lake level variations, in contrast to one for artificial reservoirs. Mantle convection would be another potential contributor to a PM trend, but have not included this effect due to its large uncertainty. Large earthquakes would also affect the PM trend . The small trend discrepancy (shown in Figure 4) in observed and estimated PM excitations found in this study may be further reconciled by including these effects.
Let’s move on to the conclusions, shall we?
Global climate model estimates indicate that groundwater depletion is a significant contributor to GMSL rise. Since the launch of GRACE [in 2002], observations of time-variable gravity show large amounts of groundwater depletion and resulting sea level rise. Prior to the GRACE mission, GMSL budgets indicated declining groundwater, but confirmation from direct observations was lacking on a global scale [i.e., everything said about pre-2002 changes is thus: speculation]. Independent confirmation of groundwater's contribution to GMSL changes might come from variations in Earth’s dynamic oblateness (J2 [Earth being no perfect sphere, it wobbles]) and polar motion (PM). We found that J2 is not especially useful for this purpose because of the geography (low latitudes) of aquifers that have been depleted in this period, and uncertainty in GIA predictions regarding J2. On the other hand, PM excitation, (x1, x2), for 1993–2010 is sensitive to global groundwater changes, and observed and predicted PM excitations agree well with each other. We found that groundwater depletion was the second largest (4.36 cm/yr) component of PM excitation trend toward 64.16°E during 1993–2010. Among known sources of PM excitation, groundwater changes are particularly important to explain the x2 component, trending toward 90° east longitude. Neglecting groundwater depletion in the PM excitation budget leads to a trend that is more westward than observed. Various choices for estimates of other surface mass load contributions lead to the same conclusion. This confirms that groundwater depletion is a major source of GMSL rise during the last a few decades as previously indicated by these models.
Isn’t this awesome? Data from 2002 onwards confirms the importance of groundwater depletion deriving from earlier models. It is, in Seo et al.’s words, ‘the second largest (4.36 cm/yr) component of PM excitation trend’. What the study does not mention is ‘the other’ two, not one, components of polar motion, which are, according to the Int’l Earth Rotation and Reference Systems Service (my emphasis):
The motion of the rotation axis of the earth relative to the crust has three major components. A free oscillation with period about 435 days (Chandler wobble) and an annual oscillation forced by the seasonal displacement of air and water masses, beating which each other, give the characteristic pulsating shape of the motion, represented in Figure 1 (dots at 5-day intervals). The mean pole has an irregular drift in the direction to 80deg. West, shown as a solid line.
According to NASA, these three components are ‘contemporary mass loss primarily in Greenland, glacial rebound, and mantle convection’.
With these three broad contributors identified, scientists can distinguish mass changes and polar motion caused by long-term Earth processes over which we have little control from those caused by climate change. They now know that if Greenland's ice loss accelerates, polar motion likely will, too.
Interestingly, these factors have been excluded from the paper ‘due to its large uncertainty’.
Bottom Lines
Basically, what Seo et al., looking at polar motion and sea level rise from 1993-2010 have done, then, is something more like putting together (mostly) estimates and models with very time-limited observations—remember: GRACE began in 2002, the Argo Floats in 2006—while excluding the three main contributors to polar motion.
There are at best eight (!) years of GRACE data and four (!) years of Argo data based on observations in a paper that discusses the period from 1993-2010.
I do see their contribution as something that amounts to adding a partial explanation to the difference in the sea level rise budget as theorised vs. observed.
Yet, it is hardly surprising that legacy media has portrayed these ‘findings’ as something very different: lots of certainties and emotions vs. the dry and partially strange wording in scientific papers.
Still, the discrepancy between estimates and models vs. observations and measurements is palpable.
I am not saying this is a junk paper, but I do find it curious that much of the data input are models and models while significant factors have been omitted.
Moreover, data availability and timeframe chosen do not align very well as the majority of the period under consideration does not rely on the same inputs. What is done by Seo et al. is called splicing, that is, the combination of multiple different data sets into one model.
Finally, what about the south pole? The above paper discusses the movement of the north pole, but as far as I can tell, we should be able to observe comparable motions on the other side of the Earth, yet there is no mention of it.
In light of ‘da Science™’ debacle of the past 3.5 years with respect to medicine, pharmaceuticals, and public health (sic), the above is bad, but not altogether surprising.
I do want Science back, though, for if we continue down this pathway of ‘da Science™’, we may as well end up reverting to a pre-Scientific Revolution era whose hallmarks were (are) not observation-description-interpretation (incl. replication) but articles of faith.
Do I believe in ‘Climate Change’?
Sure, the climate is always changing, but the US$ 44,000 question is mankind’s contribution, and with papers like the one discussed above—or the observations of Antarctic ice gains I discussed recently (see here, incl. links to two other studies)—asking this question has become a kind of article of faith, with ‘climate science’ and its practitioners engaged in a kind of pseudo-scholastic enterprise whose gate-keepers disallow all ‘meddling’ with their nice academic fiefdoms, gov’t grants, and other ‘perks’.
As Dwight Eisenhower explained in his farewell address in 1961 (emphases added),
research has become central; it also becomes more formalized, complex, and costly. A steadily increasing share is conducted for, by, or at the direction of, the Federal government.
Today, the solitary inventor, tinkering in his shop, has been over shadowed by task forces of scientists in laboratories and testing fields. In the same fashion, the free university, historically the fountainhead of free ideas and scientific discovery, has experienced a revolution in the conduct of research. Partly because of the huge costs involved, a government contract becomes virtually a substitute for intellectual curiosity…
The prospect of domination of the nation’s scholars by Federal employment, project allocations, and the power of money is ever present and is gravely to be regarded.
Yet, in holding scientific research and discovery in respect, as we should, we must also be alert to the equal and opposite danger that public policy could itself become the captive of a scientific technological elite.
Yes, this is from Eisenhower’s speech warning us about the ‘military-industrial complex’.
It is worth pointing out he held up both the ‘military-industrial complex’ and the capture of science as equal threats to a free and open society.
And in this vein, the solution to questionable propositions is—transparency.
Like democracy, ‘da Science™’ will expire once exposed to sunlight and scrutiny.
Let’s help ‘nudge’ it in this direction.
One of the more hilarious (as in: my weird sense of humour) aspects is the comment by Dieng et al. 2017 that follows directly after the above-related definition: ‘in theory, salinity does not contribute to global mean sea level change because of salt conservation on long time scales, but as measurements are never fully global, in practice, salinity is accounted for when available’. Isn’t science wonderful?