While preparing my last couple of posts on the evolving Norwegian Covid situation (see here and here), I noticed something that looked odd at first sight.
On its website, the Norwegian equivalent of the CDC—it’s the Norwegian Institute of Public Health (IPH)—provides the following key facts about the national ‘vaccination’ efforts:
As the dedicated ‘statistics’ website explains, these data ‘show the number of people vaccinated daily with the 1st and 2nd dose of vaccine against COVID-19 in Norway, from and including 27 December 2020’.
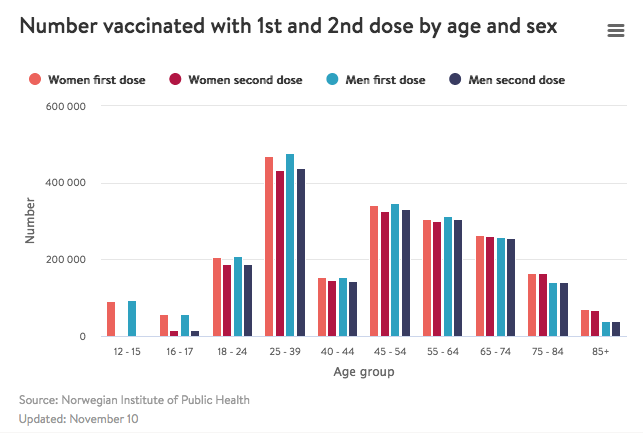
Overall, these break down as follows by sex and ‘vaccination’ status:
As is clearly visible, for whatever reason, the age bracket 40-44 year-olds is significantly under-‘vaccinated’. The numbers in the four categories are as follows (as of 10 Nov. 2021):
Women first dose: 145,734
Women second dose: 146,426
Men first dose: 153,835
Men second dose: 144,605
Now, a brief look at the official government statistics about this age bracket reveals a small problem: the statistics office offers data that allows to enquire about the ‘vaccinated’ share of this particular subset of the total population.
According to official government data (2021), these data break down as follows:
87,800 women
97,090 men
Adding both gives the total of 184,890 individuals aged 40-44 who currently live in Norway.
In a next step, let’s estimate the relative share of Norway’s currently resident female and male population according to their ‘vaccination’ status as recorded in the national vaccination system (SYSVAK):
Women first dose: 145,734 = vaccination rate of 166 %
Women second dose: 146,426 = vaccination rate of 167 %
Men first dose: 153,835 = vaccination rate of 158 %
Men second dose: 144,605 = vaccination rate of 149 %
This is odd: the official numbers of one government agency (the Institute of Public Health) differ significantly from the other government agency (Statistics Norway).
What’s even odder (if that’s a word) is the supreme discrepancy to the above graph, taken from the IPH’s website that shows an evidently lower rate of ‘vaccination’ among those aged 40-44.
To add to the confusion, there are widely differing accounts in the country’s media, as the following examples show. This, e.g., is what the ‘vaccination’ status looks like in Oslo-based daily Aftenposten (the country’s NTY equivalent), as of 11 Nov. 2021:
And this is how Bergens Tidende, the local daily in Norway’s second-largest city, Bergen, shows ‘vaccination’ status, again as of 11 Nov. 2021:
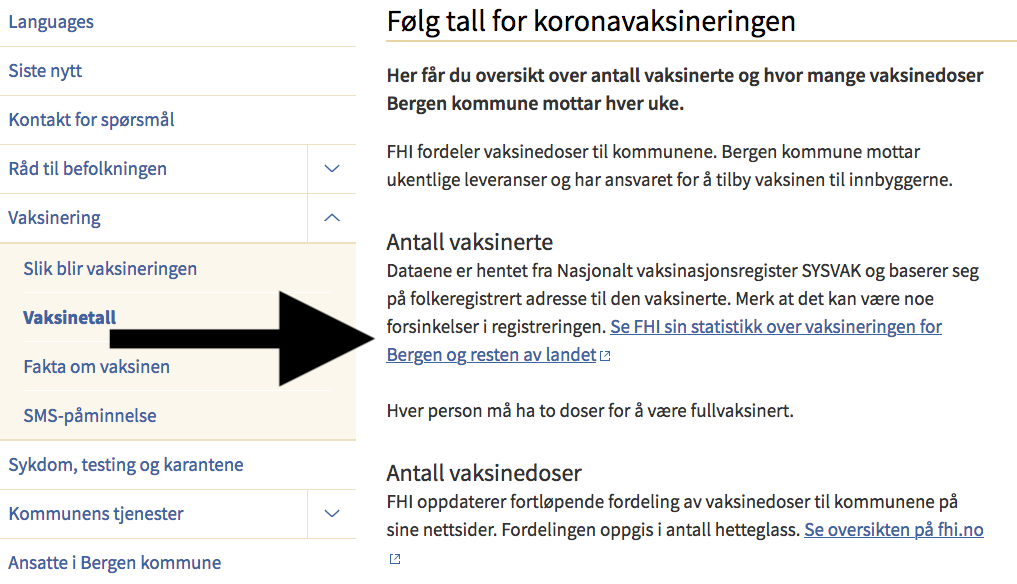
At this point, let it be known that both papers are based on the Institute of Public Health’s official numbers related above. Even the official numbers from Bergen Municipality come, as the below screen shot indicates, from the IPH (and if you go to that link in the screen show below [here], it will take you back to the IPH’s ‘vaccination statistics’ website this post began [here]).
Thus, the issue becomes not only ever more confusing, but the question itself morphs into the following: is this circular statistics (for it’s certainly anything but circular reasoning, isn’t it)?


