Covid in Norway: data for week 9 confirms booster 'protection' failure 120+ days out; drastic rise in non-Covid admission since autumn 2021 reeks of potential immune suppression
Trends from last week continue, but the pace is quickening: admissions of injected clearly outpace injection uptake, no more injection protection from severe disease visible: brace for impact
Another Wednesday has passed, so it’s time for a brief recap of the numbers published by the Institute of Public Health’s (IPH) update for week 9. As always, I’ll provide you with the page numbers of sub-chapters and quotes, with all emphases mine.
Executive Summary (pp. 3-4)
Hospitalisations for Covid-19 as main cause are still rising and reached 512 in week 9 (up from 430 in week 7 and 450 in week 8), which corresponds to another 14% increase week-over-week (they were up 14% in week 8, too). One of the main benefits of the Norwegian data is that we also learn the overall number of new admissions, which in week 9 stood at 932 (up from 910 in week 8), which is to say that Covid-19 was given as the main cause for hospitalisation in 55% of these cases.
‘The number of new admissions per 100,000 inhabitants was highest in the age group of 85+’, which, again, isn’t a surprise. Here’s a breakdown of hospitalisation incidences by age group, incidence, and numbers from both weeks 8 and week 7 (in parentheses):
85+: incidence/100,000 = 132, n = 71 (week 8: 77.5, n = 91; week 7: 53.6, n = 63)
75-84: incidence/100,000 = 71, n = 219 (week 8: 35.4; week 7: 29.2)
65-74: incidence/100,000 = 17,8 (week 8: 15.7; week 7: 13.9)
Among all other age cohorts, hospitalisation incidences ‘was relatively stable or declining’.
Obviously, hospitalisations for Covid-19 ‘as main cause’ are still rising, and they were rising even more last week due to reporting delays. Note that this is really telling—Omicron (whatever variant) is supposedly ‘mild(er)’ than previous strains, but shouldn’t the incidence rates per 100,000 reflect this perceived ‘mildness’, too?
Injection status was known in 511 cases (note here that 512 admissions occurred due to Covid-19 as main cause; 511 out of 932 comes down to 55% of the total). Of these, 97 (19%) were ‘unvaccinated’, 83 (16%) had received two doses, and 321 (63%) were ‘vaccinated with three doses’. For comparison, here’s how these numbers looked in the past two weeks:
Week 7: 87 (26%) ‘unvaccinated’, 58 (18%) two doses, and 175 (53%) with 3 doses
Week 8: 119 (24%) ‘unvaccinated’, 86 (18%) two doses, and 268 (55%) with 3 doses
In other words: in one week (from week 8 to week 9), admissions of ‘unvaccinated’ and two-dose recipients declined by 19% and 3%, respectively, but they rose by 20% for three-dose recipients. Note, though, that the ‘decline’ among two-dose recipients is quite likely a data artifact, for their numbers are still 43% higher than in week 7.
Hospitalisations of three-dose recipients rose by 83% in the past two weeks alone, and I think it’s fair to call the current situation a ‘health crisis of the triple-injected’.
ICU admissions and deaths are both rising, too, with the former being quite telling: there are currently 44 ICU patients (week 9), up from 39 (week 8) and 38 (week 7); note that the number for week 9 is likely subject to adjustment. For comparison: in weeks 4-6, there were 15-19 new ICU admissions, in weeks 7-8, it was twice that number, and in week 9 ICU admissions climbed higher still.
Covid-associated deaths are similarly rising: there were 48 cases in week 7, 57 such reports in week 8, and 59 in week 9 (with the same caution, i.e., that number will be ‘adjusted’); the median age was 84. The IPH also notes that all-cause mortality ‘was normal in the past two months, including persons 65 years of older’. All-cause mortality is said to have been within the long-term range, with the exception of weeks 43-45 and 47-51 in 2021.
Brief comments: Two weeks ago, I spoke of ‘alignment’, by which I meant the eventual (temporary) equilibrium between hospitalisation rates and injection status. We may be moving beyond that perceived ‘plateau’ as I write this. As of 6 March 2022, 53% of the overall population has received three doses, and uptake has been incredibly high among all age brackets 45 years and older: 89% of all over 65, 82% for those over 45, and 66% of all residents over 18. Like elsewhere, these overall uptake numbers barely move anymore, which suggests that injection uptake is cratering.
Two weeks ago I wrote this:
I’d tentatively hypothesise that the younger the ‘vaccinee’, the less overall risk for a Covid-related and/or injection-related admission. That said, while I therefore doubt that we’ll see rates in perfect alignment with injection uptake, I suppose that we haven’t yet reached the ‘ceiling’ of Covid-related hospitalisations.
And this week we have moved on into the next phase where hospitalisations will continue to climb (and presumably continue to ‘baffle’ the experts), but it’s really easy to see the correlation between injection uptake and admission. And if you’re not inclined to believe me, here’s something else I’d like to show you (the below screen grabs are from this statistics page of the IPH).
Trend line for hospital admission with a confirmed Covid-19 infection as main cause:
Trend line for ICU admission with a confirmed Covid-19 infection:
Number of Covid-19 infections after testing positive for Sars-Cov-2:
Number of persons testing positive for Sars-Cov-2 per day:
Hence the ‘assessment’ by the IPH in its most recent report (p. 4):
Omicron BA.2 is now the dominant strain in Norway, with transmission and spread continuing on a high level, but the epidemic is about to reach its peak.
High injection uptake contributes to offer protection [I’m not sure, perhaps we’re not looking at the same data here?], but the risk for a severe course of disease is very low for most infected individuals. Severe disease now affects mainly the unvaccinated and vaccinated individuals of old age or underlying health problems. It is of continued importance that unvaccinated persons get vaccinated, and that people over 45 and with elevated risk profiles 18 and older receive their booster shot.
Even if the epidemic wave is near its peak, hospitalisations are expected to rise for another couple of weeks, in addition to those who are admitted for other reasons but incidentally test positive for Sars-Cov-2. We expect a moderate increase in ICU admissions.
A significant part of the pressure on healthcare services continues to be due to staff on sick leave.
It is firmly beyond my imagination as to why both public authorities and the Norwegian population in general continues to line up for these injections. By now, their utter failure should be clearly visible to anyone who bothers, or cares, to look at these numbers.
Personally, I don’t know any ‘unvaccinated’ person who had Covid-19 symptoms that were worse than a cold in the past three months. I did hear a lot of anecdotes from people I meet—all of them presumably or certifiably ‘vaccinated’ two (some) or three (most) times—who felt quite impacted by Omicron: most speak of high fever, a couple of days of night chills, a bad cold, and the like. In short: nothing out of the ordinary for a seasonal bout of cold-or-flu-like illnesses, but I doubt they think in the same way as I did. Virtually all of them seek to rationalise their comparatively ‘mild’ encounter with Sars-Cov-2, direct and/or ‘indirect’, as a consequence of injection—and they do so by claiming that the reason they didn’t get sicker was the injection.
Brief note on the below content: I think that the detailed commentary is quite superfluous by now, so I shall delimit myself to a couple of figures and tables, incl. a brief translation/comment in the captions below.
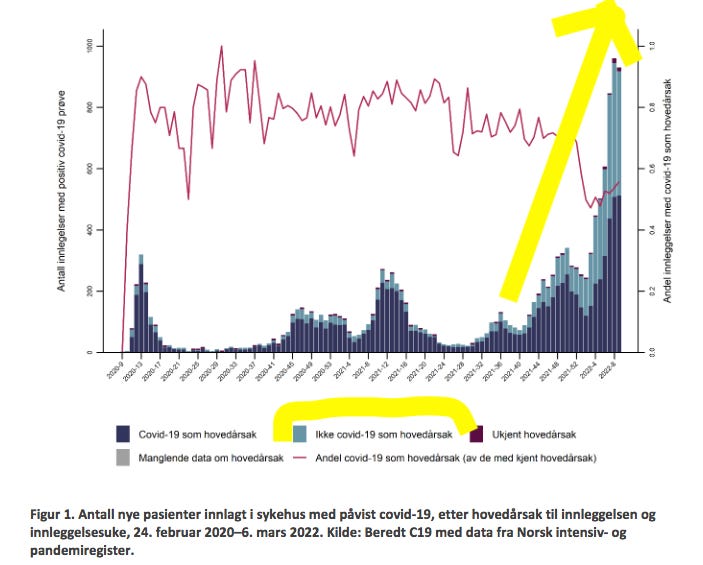
Fig. 1: new hospitalisations with/out Covid-19 as main cause shows a drastic increase in non-Covid-related admissions since approx. early autumn (± weeks 49-41), which coincides with the massive roll-out of the booster injections (the highlighted light blue columns). The thin red line shows admissions due to Covid-19 as main cause—look at the right-hand side of the caption: yep, you read that correctly: Covid-associated admissions are around .5% of all hospitalisations: talk about forests and trees here.
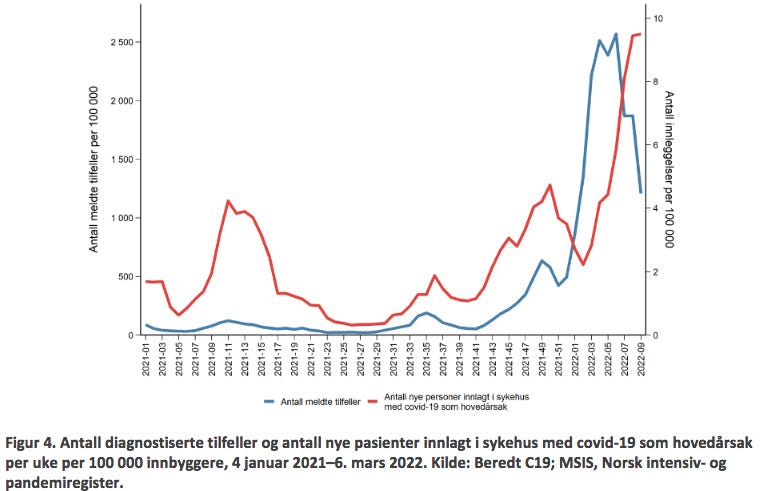
Fig. 4: positive cases vs. admissions, but do note that the visualisation is very misleading: reported test-positivity in week 8 was as high as in week 7, and it fell by approx. a third by week 9. This indicates the cresting of the Omicron wave as a function of testing has arrived, but do note that there’s no adjustment (that I know of) with respect to the underreporting factor (i.e., we don’t know how many people test positive for Sars-Cov-2 and don’t report it online). More importantly, note that hospitalisations lag positive tests by about ± 3 weeks, hence while the peak of the ‘testing wave’ may have arrived by now, hospitalisation will increase in the next couple of weeks.
Fig. 3: this one shows the development of the spring and winter waves since Feb. 2020. Note that both waves are higher in 2021/22 than they were in 2020/21, hence the only relevant question is: how much higher will the winter wave 2022 be?
Fig. 6 shows the admission breakdown by age brackets: note that, thankfully, the >1yo cohort is no longer as affected as in earlier weeks. Note, though, that the pace of 75-84yo (dotted golden line) and 65-74yo (golden line) appears to be turning upwards.
Fig. 7, which is well-known by now, shows the trend lines. Today’s trick question is—where do you think the turquoise trend (triple-dose recipients) will end up next week?
Fig. 8 shows the 14-day trends (smoothed averages) of both ‘new deaths or hospitalisations for Covid-19 as main cause’, which I’d argue serve only one purpose: to obfuscate the utter failure of the injections. Note (highlighted in yellow) that there is zero, zip, nada, zilch visible difference between ‘unvaccinated’ and ‘vaccinated’ incidences among the 18-44yo; it’s barely visible in the 45-64yo bracket, but the intentional (?), but certainly utterly misleading, conflation of both deaths and admissions—which I find a super-weird grouping—might be behind the differences in the 45-64yo bracket. I also, and very much so, doubt the accuracy of the charts for the 65+ brackets, and I do so for one main reason, summarised below:
Table 8 shows Covid-associated deaths, and I’d direct you to the past 4 weeks—for quite some time now, ‘all-cause injected’ deaths easily outpaced ‘unvaccinated’ deaths, and the above spread between ‘injection-deriving protection’ from either hospitalisation or death appears simply implausible, if not mathematically outright impossible, and…
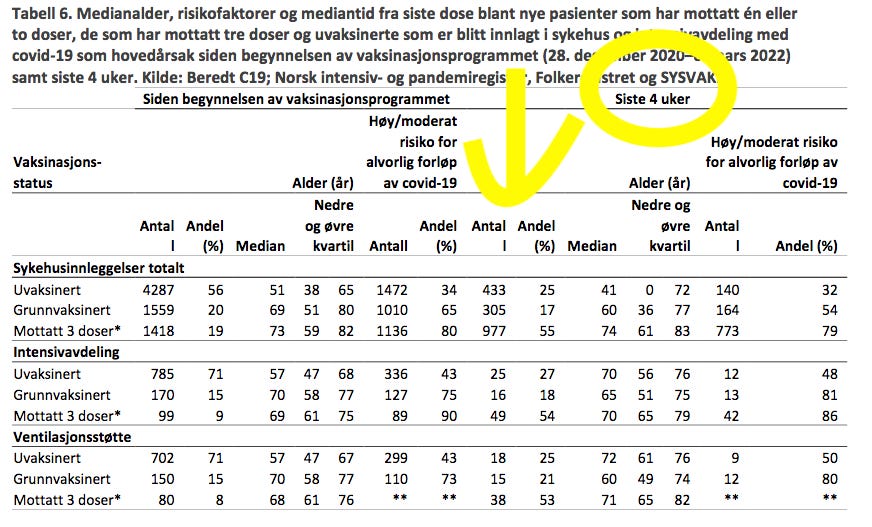
…Tab. 6 shows why I claim foul play on part of the IPH here:
Like in last week’s report, comparison over time tells the story of injection failure since the beginning of the injection program on 28 Dec. 2020. As of week 39 of 2021 (two-dose recipients) and week 48 of 2021 (booster recipients), and now there are…
Hospitalisations among ‘unvaccinated’: 2,732 (by week 39 2021) vs. 4,287 (by week 9 2022) = +57% in the 22 weeks since 6 Oct. 2021
Hospitalisations among ‘fully vaccinated’ (2 doses): 193 (by week 39 2021) vs. 1,559 (by week 9 2022) = +808% in the 22 weeks since 6 Oct. 2021
Hospitalisations among ‘booster recipients’ (3 doses): 55 (by week 48 2021) vs. 1,418 (by week 9 2022) = +2,578% in the 13 weeks since 6 Dec. 2021
ICU admission among ‘unvaccinated’: 486 (by week 39 2021) vs. 785 (by week 9 2022) = +61% in the 22 weeks since 6 Oct. 2021
ICU admission among ‘fully vaccinated’ (2 doses): 24 (by week 39 2021) vs. 170 (by week 9 2022) = +708% in the 22 weeks since 6 Oct. 2021
ICU admission among ‘booster recipients’ (3 doses): 32 (by week 52 2021) vs. 99 (by week 9 2022) = +209% in the 9 weeks since 3 Jan. 2022
Brief Comments
Booster injection-induced, or -associated, ‘protection’ is rapidly waning now that the 80-120-day window admitted to has closed, in particular for those who received the third injection more than three months ago.
Second injection-associated ‘protection’ appears to be all but evaporated now; note that uptake of the second injection was basically complete by late September/early October (± week 39, ‘incidentally’), which allows us to guesstimate that whatever ‘protection’ two injections afforded is basically gone six months later.
Booster-associated ‘protection’ of severe disease—as deduced from ICU admission—is similarly waning, and faster now than last week: last week (8 2022), there were a total of 77 ICU admissions of ‘boosted’ patients, compared to 99 this week (9 2022), i.e., a 29% increase in one week, which ‘incidentally’ occurred about 3+ months after the blanket roll-out of the booster injections. There are no comparable changes with respect to two-dose recipients or ‘unvaccinated’ whose numbers rose by approx. 1% each relative to last week.
As to severity of disease potential, high-risk groups, and injection uptake, do note that compared to last week, the share of medium-to-high-risk admissions (both general and ICU) continue to sink for the ‘unvaccinated’, as opposed to a rising trend for both two-dose and booster recipients.
The share of medium-to-high risk patients (the right-most column in tab. 7) shows the numbers and shares of high-risk admissions in the past four weeks. For the ‘unvaccinated’, the shares rose: 32% for hospitalisation, (it was 27% in week 7 and 30% in week 8), 48% and 50% for ICU admission or mechanical ventilation (they were 37% and 36% in week 8 and 23% and 22% in week 7, respectively).
This picture is quite different for the ‘all-cause injected’, which are at or in excess of 80% in all categories (with the exception of two-dose recipients in the general admission line). All of these indicators are considerably higher than in the past two weeks: 71% of all ICU admissions for two-dose recipients were medium-to-high risk patients in week 8, and now their shares are 81% and 80%, respectively. As for the booster recipients, 80% of all ICU admissions for three-dose recipients were medium-to-high risk patients in week 8, and now their shares are 86% and ** (i.e., higher than 86%), respectively.
The Shape of Things to Come
Beware the time-lag between test positivity numbers vs. hospitalisations, ICU admissions, and the requirement of mechanical ventilation of 3-4 weeks. If this will hold, we’re in for a rather unpleasant surprise within the next few weeks, i.e., right around Easter. I expect these rates for the ‘all-cause injected’ to continue to rise, followed by another uptick in the death rate. I thus maintain what I wrote two weeks ago:
The rate of Covid-associated deaths for ‘all-cause injected’ is already 3X the rate of ‘unvaccinated’. Now, look again at the rates for ICU admission and mechanical ventilation, which in the past 4 weeks stood at 4X and 5X, respectively. I suspect, then, that the death ratio between ‘unvaccinated’ vs. ‘all-cause injected’ will rise to these (or higher) rates before too long.
I’d only add that with the seasonal peak of Covid (Omicron) almost behind us in Scandinavia, I suspect authorities and ‘experts’ will continue to struggle to explain this. My guess is that the most likely ‘explanation’ that we’ll be offered (fed) to be that this was all caused by the revocation of the mandates—even though it’s been the IPH themselves who called for an abrogation of the mandates in early February 2022 as they were deemed more harmful than useful.
From last week’s reporting on these Norwegian numbers:
So, is it too far into ‘tinfoil hat-wearing’ territory to suspect the following: perhaps ‘Western’ gov’ts and public health authorities last hope is the extension of the Russian military operation in Ukraine to keep these unpleasant tendencies—which I think are pretty much baked into the situation, and there’s not much, if anything, anyone can or will be able to do about them anyways—from bubbling up.
That said, here’s the problem for the technocratic elites: go and look up ‘Rasputsitsa’, which will slow down the Russian army once it gets warmer in the next weeks. The window of opportunity of obscuring the injection failure (and the harm they do) will close within the next couple of weeks.
What will we be served to distract the people in April?
My guess today is—once the Russian incursion will be done, we’ll see a massive economic downturn due to the combination of disrupted supply chains (look esp. for artificial fertilisers, hydrocarbon energy, and staples such as wheat), which will ripple through our just-in-time-delivery systems, higher prices for everything, incl. in particular credit (think: the real estate bubble), and the social fall-out from these issues.
I don’t want to sound all doom-and-gloom today, but the Russian troops are all but done with Ukraine, there will be no military aid from ‘the West’ for Mr. Zelensky (not all ‘Western’ policymakers are suicidal, esp. those in Eastern Europe), and there’s no upside for anyone talking about all matters Covid-19 anymore: the data is horrible, more carnage is ahead of us, and there’s no way these policymakers are admitting their mistakes.
So, the next major economic downturn (which is also overdue anyways) it will most likely be. The only question is—how fast, how deep, and how long the contraction will be.


