While preparing the above piece, I happened across another titbit of information, which I deem relevant here—hence today’s posting is about the size and share of the labour force in Norway.
So far, stacking up all transfer payments could get a refugee™ with kids but w/o work up to 600,000 Norwegian Crowns (divide by 12 to arrive at US$ or euro equivalents) per year. Mind you, that would be without lifting as much as a finger.
We note, in passing, that this is about the same amount as the median annual earnings before taxes in Norway, which were around 606,000 crowns in 2025, i.e., half the labour force earns less than that which is given to refugees™. Paid for by those who are taxed by the gov’t.
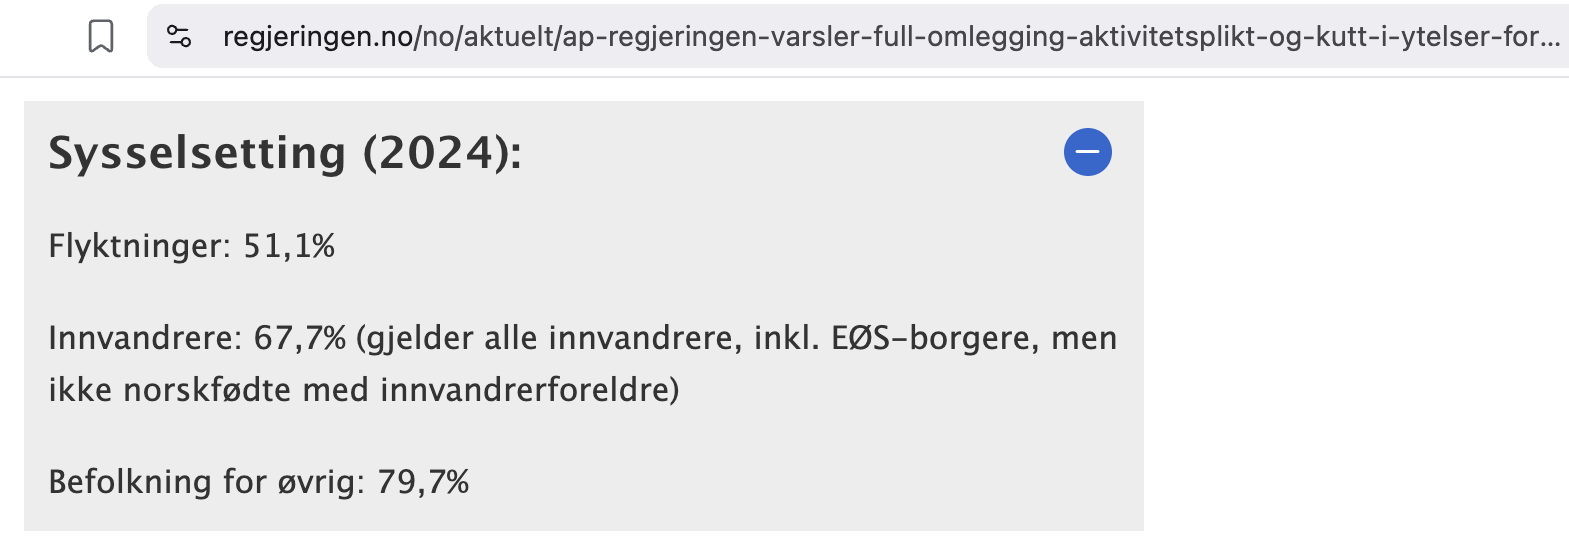
When surveying the gov’t’s proposal on this website (sent to parliament on 23 Jan. 2026; the deadline for comments and amendments is 23 April 2026), I noticed yet another peculiar item that stuck with me, and it is summarised below:
Employment (2024):
Refugees: 51.1%
Immigrants: 67.7% (applies to all immigrants, incl. EEA citizens, but not Norwegian-born with immigrant parents)
Rest population: 79.7%
Please allow me to explain these numbers with reference to specifics. Lots of the latter, by the way.
All non-English content comes to you in my translation, with emphases and [snark] added.
Fun With Numbers, Norway Gov’t Edition
On the face of it, it simply tells you the share of people in these three categories who are actively working; three things to note:
Fuzzy definitions that look totally arbitrary
Gov’t knowledge vs. what and esp. how they talk
What’s the share of Ukrainians vs. other immigrants working ?
Persons who performed gainful work of at least one hour during the reference week/day, as well as persons who have such work, but who were temporarily absent due to illness, vacation, paid leave, etc. Persons who are in their first military service [orig. førstegangs militærtjeneste] are considered employed. Employed is the sum of wage earners and self-employed persons (owners). Involuntary full layoffs, with a continuous duration of up to 3 months, are considered employed, temporarily absent.
You read this correctly: whenever you ‘perform…at least one hour’ per week or day (what kind of difference would that make, really), you’re counted as employed™. Note the conflation of being an employee (‘employed’) and a business-owner (‘self-employed [owners]’).
But the basic notion is—an hour of work per day or week is good enough for you to improve gov’t statistics.
Moving on to what’s in a term (‘Europe’).
What’s the Area We’re Talking About?
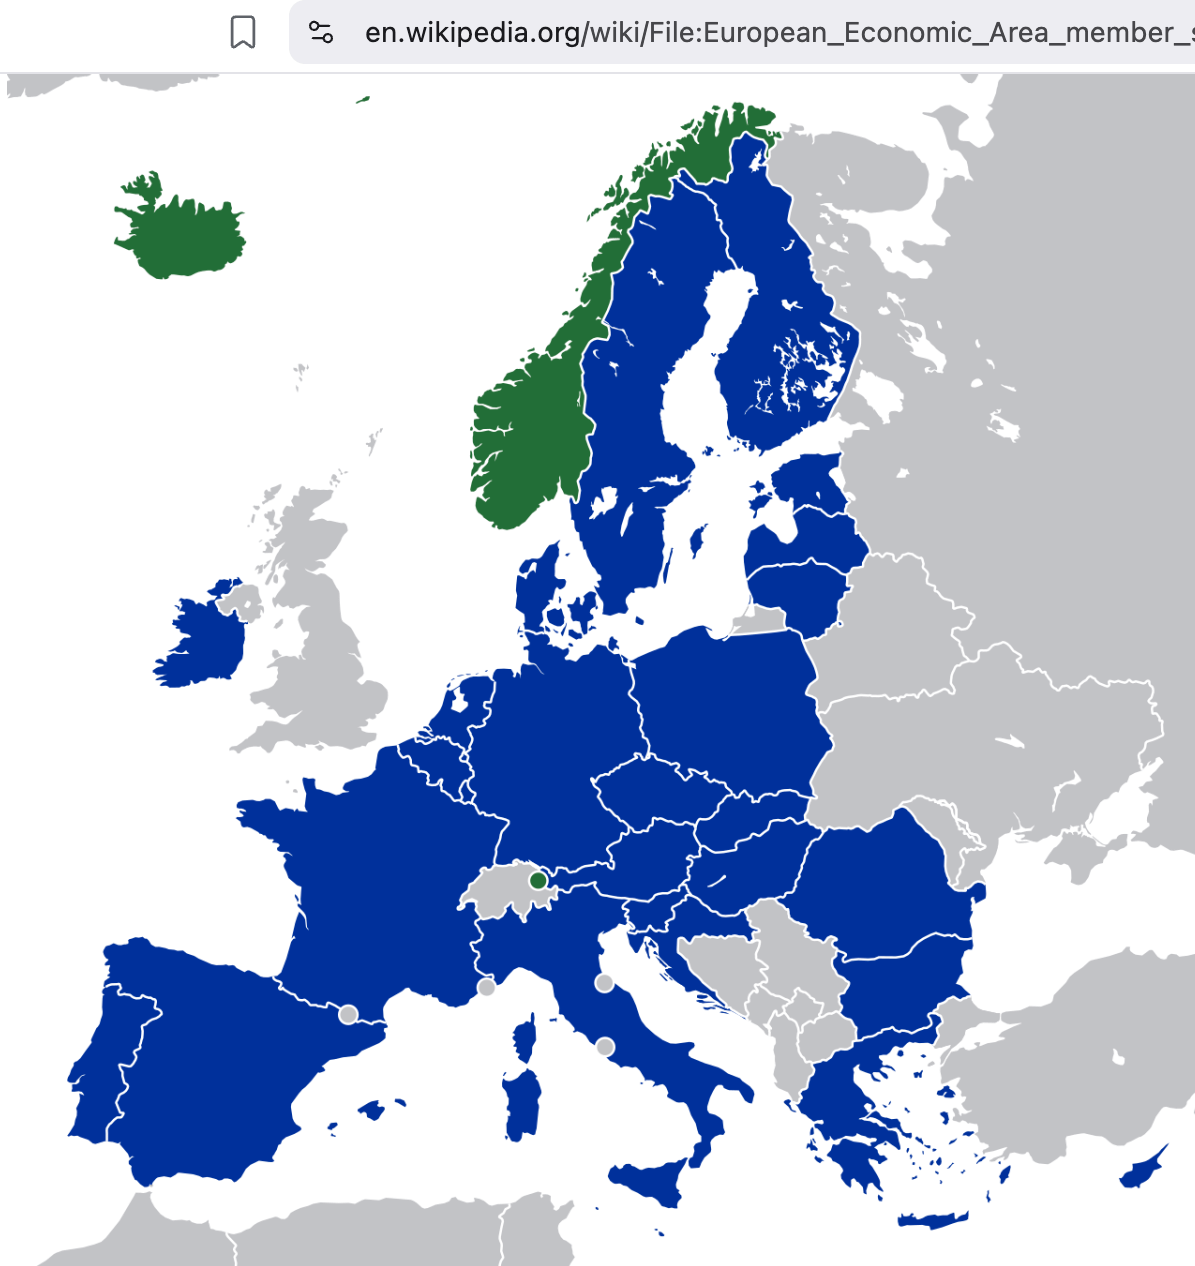
As to the area/population in the second category, the EØS, or EEA (European Economic Area; Wikipedia), here’s a map that shows you quite clearly, I’d submit, where the shenanigans with that category lie:
It conflates all the above countries (green = EFTA, i.e., non-EU member-states) in the same category, with no distinctions made—by the gov’t, no less—that are totally standard to make for, say, Statistics Norway:
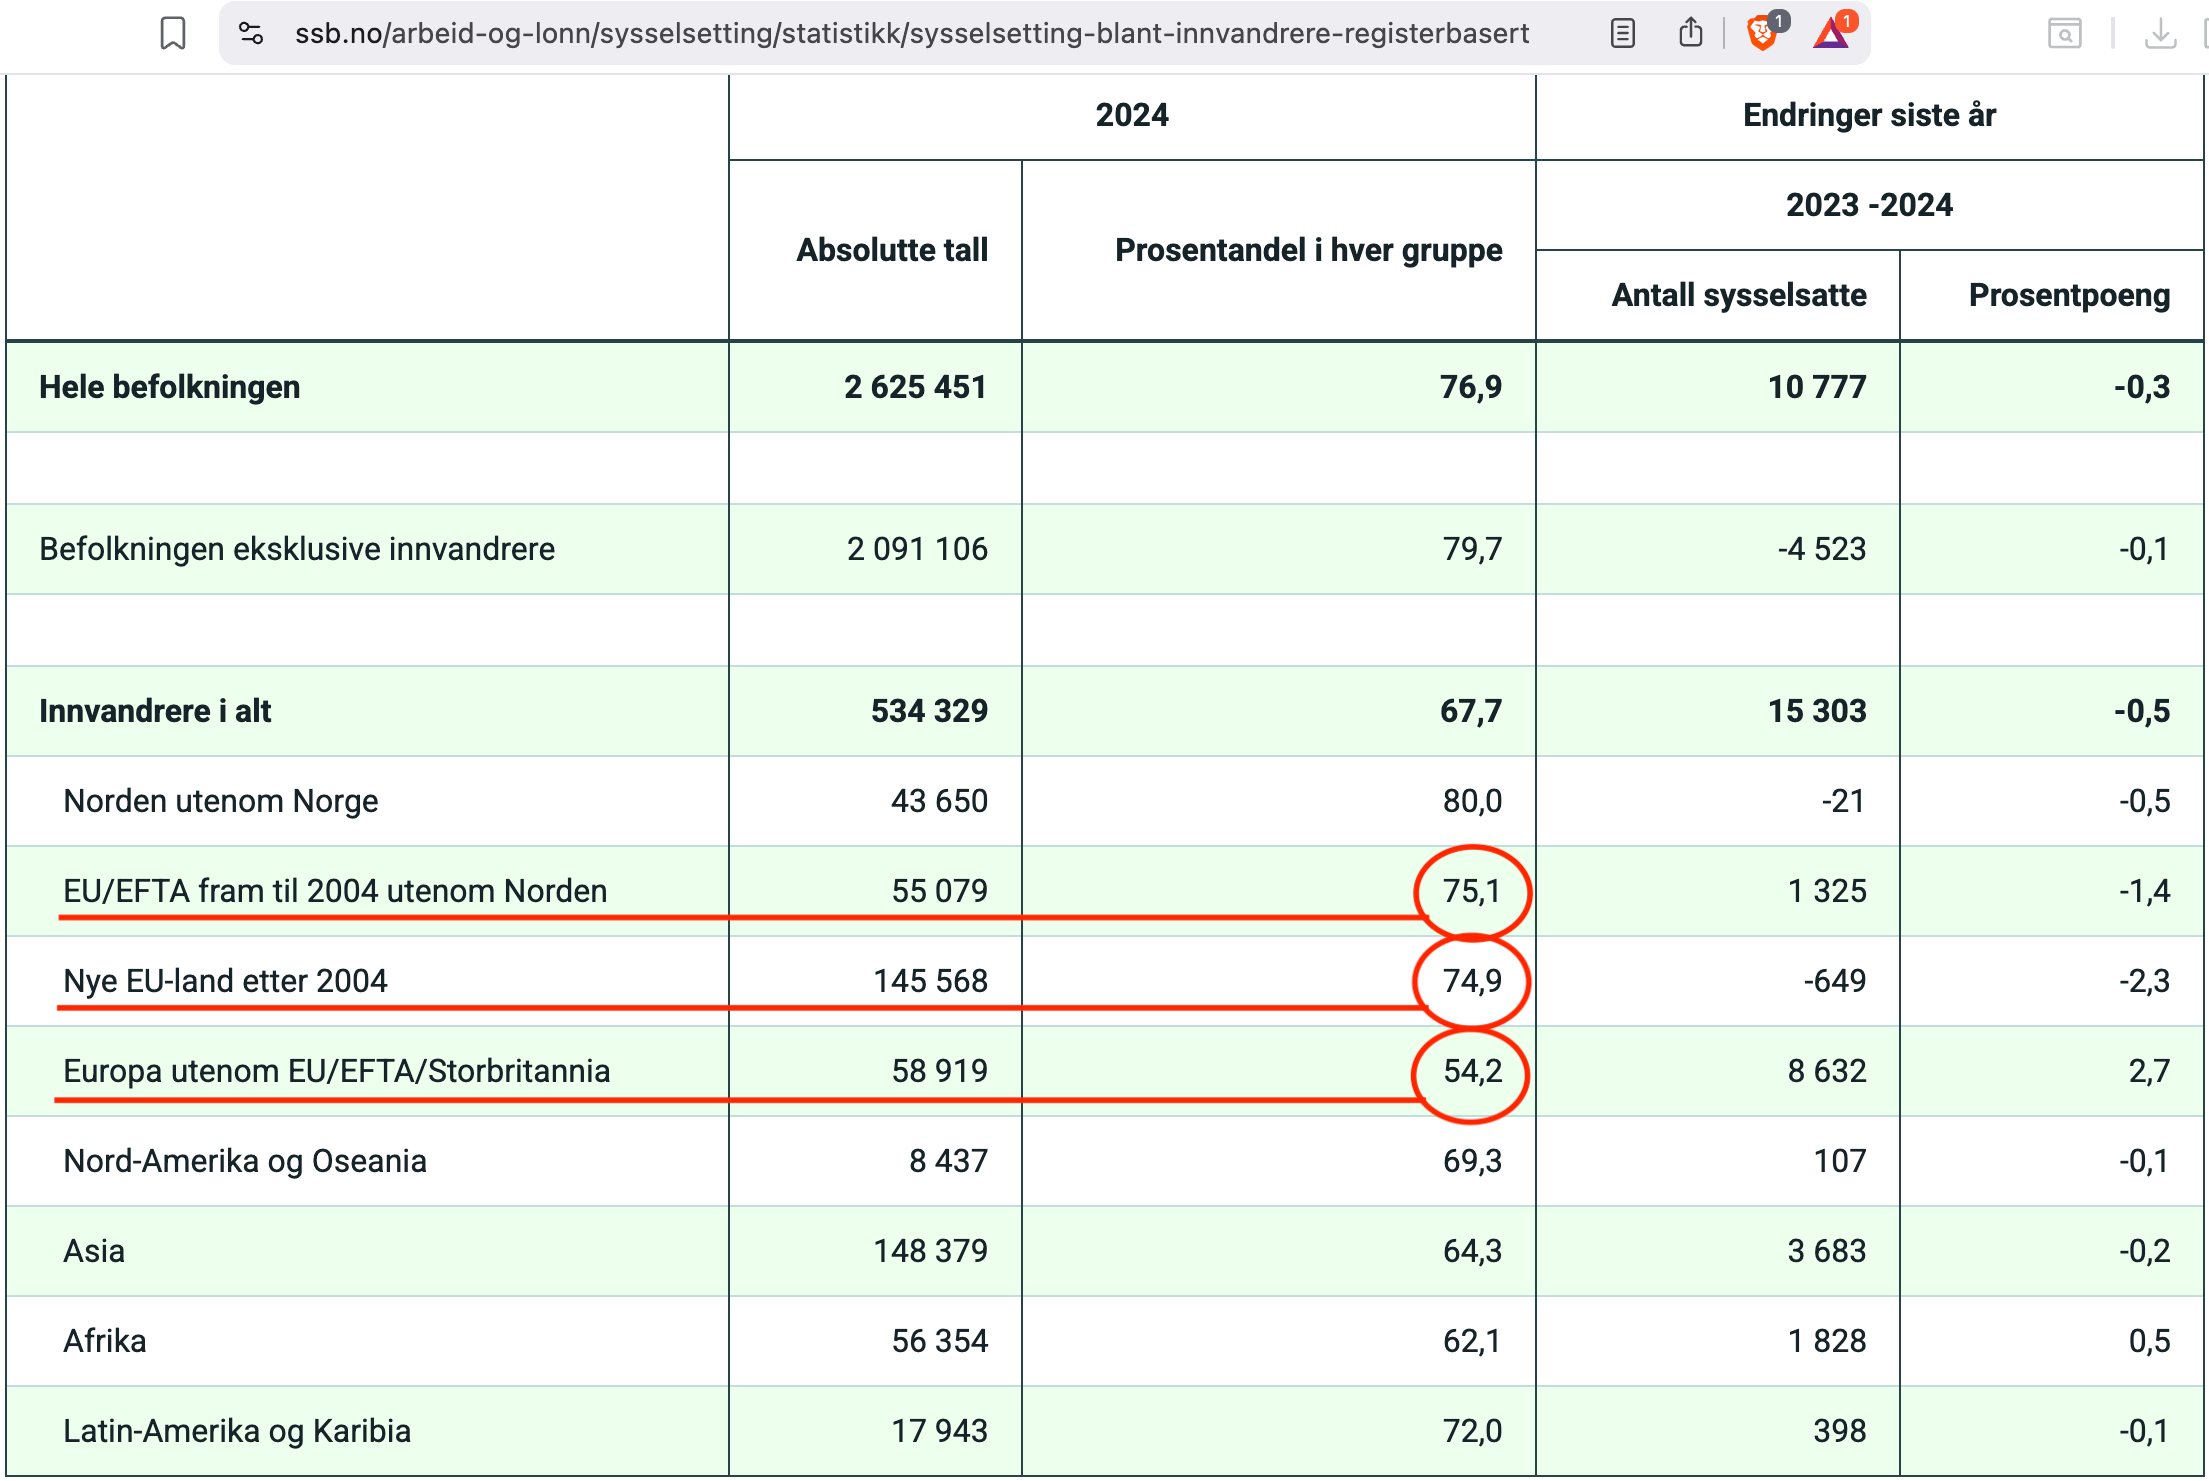
The above table shows employment rates as of Q4 2024, with me highlighting ‘EU/EFTA [EEA] member-states before 2004 except the Nordics’ (EU/EFTA fram til 2004 utenom Norden) = old EU before the so-called ‘Eastern Enlargement’ brought Slovenia, Hungary, Slovakia, Czechia, Poland, and the three Baltic states (Estonia, Latvia, Lithuania) into the EU, followed in 2007 by Romania and Bulgaria—and behold, their employment rate is 75%, only a few points below Nordic rates (80%); note, further, that ‘even’ (sic) immigrants to Norway from post-2004 EU member-states (Nye EU-land etter 2004 above) have employment rates (at 74.9%) that are virtually indistinguishable from their West European peers.
That employment rate falls significantly to 54% ‘only’ in the category ‘Europe except EU/EFTA/Great Britain’ (Europa utenom EU/EFTA/Storbritannia). Funny enough, ‘even’ (sic) immigrants from Africa have a higher employment rate (62%) than people from a rather short list of places falling in the category ‘Europe except EU/EFTA/Great Britain’.
Let’s move on to (drum roll) more granular data.
What’s the Fuzz About Origins?
Statistics Norway has such granular data available for John & Jane Q. Public, it would be a shame not to make good use of it.
The below is from Table 3, entitled ‘Employment Rate (20-66) by immigration background, continent, and age for Q4 2024’ (source), and it tells the rest of the story (given here in excerpts); all numbers below are employment rates for both sexes from the following exemplary countries from the category ‘Europe except EU/EFTA/Great Britain’:
Bosnia-Hercegovina: 72.8%
Russia: 66.1%
Kosova: 62.9%
Türkiye: 56%
Ukraine: 36.8%
Did you notice something?
Here’s another fun fact as regards places outside this category, with just a few countries listed whose citizens might also fall into the refugee™ category:
Eritrea: 74%
Afghanistan: 63.4%
Somalia: 48.6%
Syria: 46.2%
For good measure, I’ve included Somalia and Eritrea in the above listing, and immigrants from all of these places show higher employment rates than Ukrainians.
For the love of God, you cannot possibly, or plausibly, convey to me that Afghans or Eritreans have an easier time adjusting to life in Norway than, say, Ukrainians.
For fun’s sake, I’m giving you the employment shares for a few more candidates that may or may not fall in the ‘shithole’ category whose immigrants to Norway also have higher employment rates relative to the Ukrainians:
Myanmar: 74.6%
Ethiopia: 69.5%
Pakistan: 60%
Morocco: 52.1%
Iraq: 53.5%
Adding to this listing, here’s a bunch of additional immigrant categories for perspective:
Sweden: 82.8%
Philippines: 81.6%
Germany: 77.9%
Thailand: 76.4%
India: 74.6%
Great Britain: 74%
Chile: 70.7%
Vietnam: 66.9%
USA: 66.7%
Iran: 65%
I mean, look at the Filipino community—they are only outperformed by Swedes. Next to them, American labour force participation rates look like a sad joke, eh?
‘How Many Ukrainians Work in Norway?’
For the final part of this piece, we turn to Statistics Norway whose number-crunchers Martin Handeland Skjæveland and Vilde Røv recently (22 Jan. 2026) spilled the beans in a glossy, interactive article entitled: ‘How Many Ukrainians Work in Norway?’ (orig. Hvor mange ukrainere jobber i Norge?):
Over 40 per cent of Ukrainians aged 20–66 who immigrated to Norway after Russia’s invasion are employed in December 2025. This amounts to approximately 21,000 people. About 6,900 more are employed compared to the same month the previous year.
Preliminary figures for December 2025 show that there are a total of 26,880 immigrants from Ukraine who are employed and receive a salary in Norway, where 80 per cent of them have immigrated after the invasion in February 2022. All are registered residents, which means that they have been granted residence and plan to stay in Norway for more than 6 months.
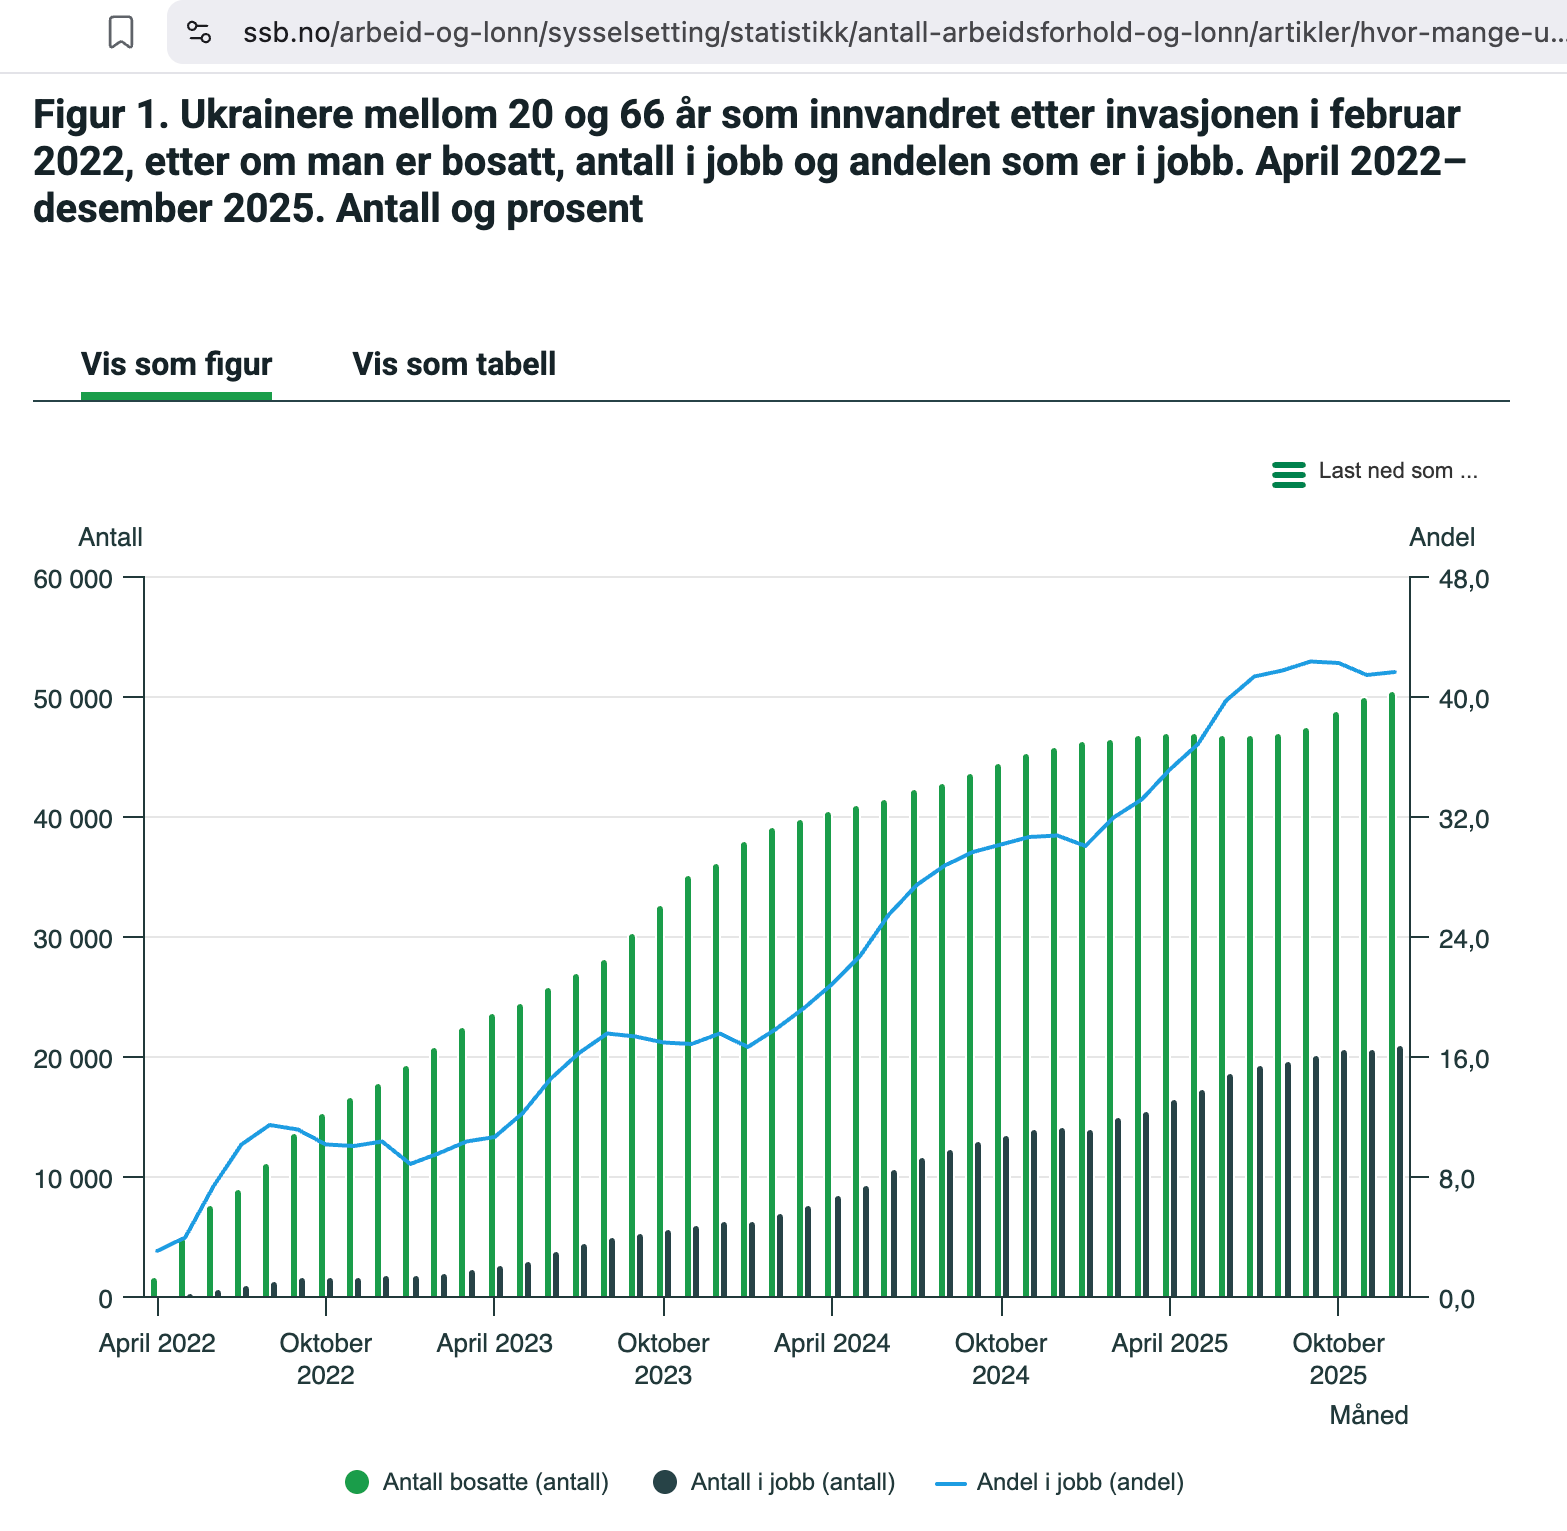
Figure 1 shows how many Ukrainians from 20 to 66 years old are resident in Norway, how many are employed and the proportion who are employed. Data are limited to those who immigrated to Norway after Russia’s invasion of Ukraine on 24 Feb. 2022.
The share in employment in December 2024 was 31 per cent, while in December 2025 it was 42 per cent. The strong increase is due to the fact that the number in employment has increased sharply during the period, at the same time as fewer Ukrainians have immigrated to Norway.
[caption: green bars = no. of residents (bosatte); black bars = no. of resident Ukrainians in employment (i jobb); blue line = share of employed (andel)
The low proportion in employment is due to the large number of people arriving from Ukraine in a short period of time and the fact that many are participating in the introduction program for newly arrived refugees during their first time in Norway. The employment figures do not include the self-employed [funny that, but in the overall definition otherwise used by SSB—as shown above—‘self-employed (owners)’—are included].
Approximately 60 per cent of Ukrainians working in Norway who came after the invasion are women, and most are young. About 60 per cent of wage earners are under 40 years of age, while around 4 per cent are over 55 years of age.
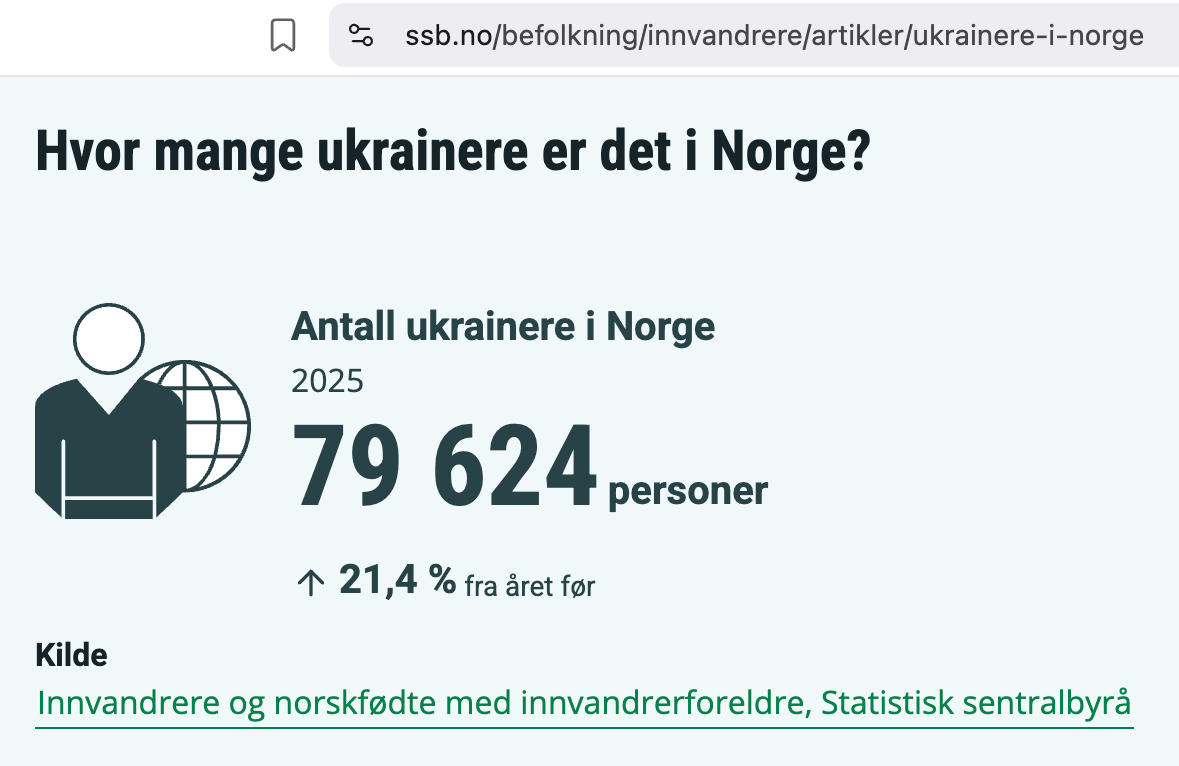
Close to 80,000 Ukrainians as of the end of 2025, and their numbers have increased by a whopping 21.4% compared to 2024.
Interestingly enough, if you do a little math on these numbers—80K Ukrainians are in Norway of whom about 50K work™ (as defined by Statistics Norway, i.e., at least one hour/week)—these actually indicate that the share of Ukrainians who work™ should be about 62-63%, yet in that other Table 3 by the very same Statistics Norway, they say it’s 38-39%.
Funny numbers, I suppose, right? Right.
Bottom Li(n)es
I do know a bunch of Ukrainian refugees who live in my neck of the woods (pop. around 2,200, small town in rural Norway), and none of them speak Ukrainian (they all speak Russian). They are all very nice people, and their kids go to school with my girls. There’s at least three families with children, that makes some 6 adults (three men and three women each) with five children in total.
I know that one of the men works™ at the municipal recycling yard (which isn’t really municipal because it’s been outsourced to a contractor); that recycling yard is open for John & Jane Q. Public every Thursday from noon to five (in winter) or six (in summer) p.m. His Norwegian is pretty bad for having been here since autumn 2022, and according to either definition™ used by Statistics Norway (one or more hour of work™/week), he’s gainfully employed™.
You cannot, of course, extrapolate from this anecdote—but to remember that anecdotes are the parents of data.
So, next time you see a particularly outrageous piece of legacy media reporting™ on ‘them pesky foreigners’ using a picture of an Afghan man or an Eritrean woman (guilty as charged), you can point them to these stats discussed here.
I’m not calling the Ukrainians lazy, grifting bums, but I would point to the fact that, compared to literally all other immigrant nations, they are laggards in terms of employment vs. living on the dole.
Yet, one would suspect that the fuzzy, arbitrary, and obfuscating way of portraying one kind of data (consider the definition once more) or another as BS, gaslighting, and ill-intentioned.
You know, like the Norwegian gov’t is doing conflating Serbs, Bosnians, Montenegrins, (Kosovo) Albanians, Macedonians, Moldovans, Ukrainians, Belarusians, and Russians as working™ (at least one hour/week) way less than everybody else.
If there’s a lesson in terms of laziness and shoddy work, it’s legacy media and gov’t (staffers), first and foremost, and after a long while, one can, rightfully so, blame the Ukrainian refugees.
Everything else is chit-chat for the kid’s table.
Feel free to join them, if you’d prefer that.
Thanks for reading Die Fackel 2.0! Subscribe for free to receive new posts and support my work.
Again, I say Norway is copying Sweden in being stupid, and is trying to out-do us as well.
Why? Because our Office of Unemployment, Statistics et cetera use the very same dodges.
Staistics used to protect a political narrative means politicians use the narrative as basis for decisions, meaning the decisions and strategies emplyed will at best be ineffective, at worst compound the problem.
For a most triumphant example, consider China's demographic crisis. I's not due to toxins or one child-policy or even cultural chauvinism - it's due to every party creature from the bottom up knew, from the days of Mao, to never report numbers showing anything counter-narrative.
And so the errors compounded, decade after decade, and policy was based on errors, and eventually the bill came due - an error in pop. no. that may be in the hundreds of millions of people.
Same here, with unemployment. For a fun time, try to find via Statistics Norway how many adults are self-supporting, drawing no welfare or benefits. That's a far more useful number. For Sweden, it is around 60% or so (from memory and the number is at least a decade old).
And since the public is pretty stupid when it comes to these things, no government-in-office can adress the problem and create the real numbers.
Because: they'd get the blame, despite the origin laying decades in the past.
Thanks for pointing out the deliberate misleading Norwegian labor statistics. Labor participation rates are indeed a governmental hoax created to convince the population into believing two lies: a) diversity is a strength. b) paint a glossy picture of government policies. SSB.no is a government agency. It will never tell the truth, especially regarding race based crime statistics.


Again, I say Norway is copying Sweden in being stupid, and is trying to out-do us as well.
Why? Because our Office of Unemployment, Statistics et cetera use the very same dodges.
Staistics used to protect a political narrative means politicians use the narrative as basis for decisions, meaning the decisions and strategies emplyed will at best be ineffective, at worst compound the problem.
For a most triumphant example, consider China's demographic crisis. I's not due to toxins or one child-policy or even cultural chauvinism - it's due to every party creature from the bottom up knew, from the days of Mao, to never report numbers showing anything counter-narrative.
And so the errors compounded, decade after decade, and policy was based on errors, and eventually the bill came due - an error in pop. no. that may be in the hundreds of millions of people.
Same here, with unemployment. For a fun time, try to find via Statistics Norway how many adults are self-supporting, drawing no welfare or benefits. That's a far more useful number. For Sweden, it is around 60% or so (from memory and the number is at least a decade old).
And since the public is pretty stupid when it comes to these things, no government-in-office can adress the problem and create the real numbers.
Because: they'd get the blame, despite the origin laying decades in the past.
Thus, it spirals.
Thanks for pointing out the deliberate misleading Norwegian labor statistics. Labor participation rates are indeed a governmental hoax created to convince the population into believing two lies: a) diversity is a strength. b) paint a glossy picture of government policies. SSB.no is a government agency. It will never tell the truth, especially regarding race based crime statistics.