


'The Science™' Maps Future 'Heat Stress'
Believe it or not, more fearporn in this dreary, wet, and cool summer of 2025

A week ago I shared some of the most recents exploits of ‘the Science™’, namely the major grant awarded to the Vienna–based Complexity Science Hub (that, sadly, ain’t no joke, fellas) run by Covidian astrologer complexity scientist (don’t ask me what that means), Peter Klimek:
It didn’t take long before the Complexity Science Hub (sic) had its first major referral in Austrian legacy media, namely a piece run by state broadcaster ORF.
While ‘summer’ leaves much to be desired, that piece is such a wonderful piece of agit-prop, let’s see if you can spot the spin (doh).
Translation and emphases mine, as are the bottom lines.
More Counties At Heat Risk
Via red, science.ORF.at/Agenturen, ORF Online, 16 July 2024 [source]
A new interactive map shows the heat load [sic] in Austria. Researchers calculated an exposure index for each district and municipality for the years 2018 to 2023 [awesome, isn’t it? Now you now how dangerously ‘we’ lived even B.C. (before Covid)], taking into account the number of heat days and the share of the population over the age of 65. The number of districts at risk is already increasing during this period, and without greenhouse gas reductions, almost every district will be at very high risk by 2050.
The increasing number of hot days represents a considerable health burden, especially for older people, emphasise the scientists from the Complexity Science Hub (CSH) Vienna and the Vienna University of Economics and Business (WU) in a press release. Between 2015 and 2022, each additional heatwave day—i.e., days with temperatures above 30 degrees Celsius—increased mortality in Austrian districts by 2.4% per 1,000 inhabitants, they write in their paper on the interactive map, which has not yet been peer-reviewed [let’s note, for the record, that I’ll discuss this in the bottom lines—but I’ll add this right away: a heat-wave, as defined in the following paragraph, is ‘a week with more than three hot days’, i.e., three days with temperatures above 30 degree Celsius—and if there’s a fourth such day, more people day, or so it is claimed in a non-refereed study; I do have a few bridges to sell, in case you’re considering buying that other argument…]
If there are more than 25% over 65-year-olds in a district, this effect even doubles [as if that share doesn’t change over time, eh?]. During heatwaves (defined as a week with more than three hot days), the increase in mortality rates is almost three times as high as the increase on a single hot day [guess what: 1 hot day times 3 = 3 times as many heat days; I now must check out the math in that paper…]. According to the researchers, heat-related health problems will increase [in more primitive times, doing so would either be a miracle or blasphemy: pick your choice] as the population ages: whereas in 2023 only a quarter of people in 15% of districts were older than 65, by 2050 this will be 80% [this is, by the way, why this cannot be done by any one individual but an entire ‘Complexity Science Hub’ is needed to keep track of this].
More Stressors in the East [also, the sun rises in the east, jus’ sayin’]
The increase in heat risk can already be seen between 2018 and 2023, which the team led by Hannah Schuster from CSH and WU Vienna used for their interactive map: during this period, there are more and more districts with a medium and very high heat risk. Eastern Austria in particular is exposed to a high heat load.
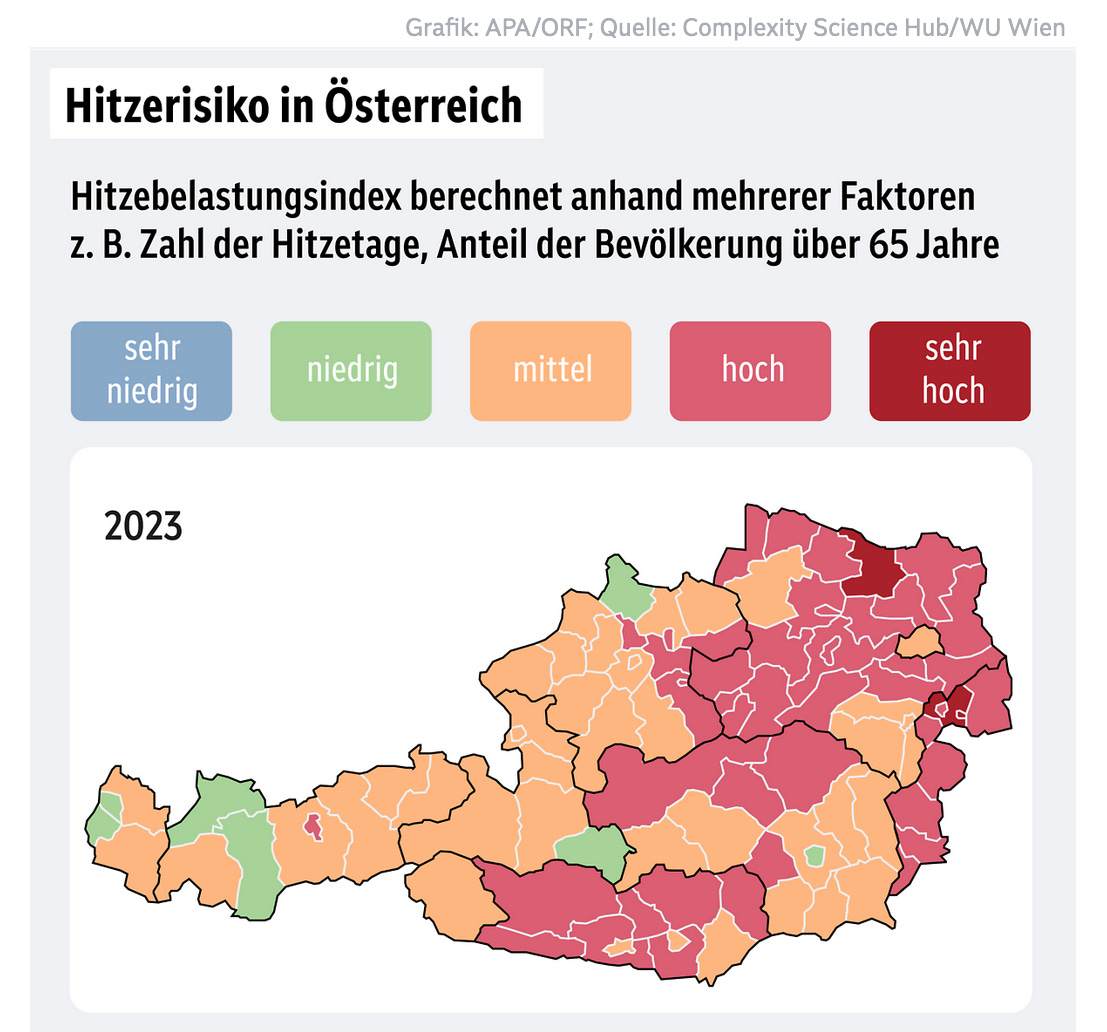
This is a two-part illustration showing the ‘heat-load [whatever that is] index as calculated based on, e.g., heat-days, share of population 65 and older, etc.

In 2023, the districts of Hollabrunn, Eisenstadt-Umgebung, and Rust had a ‘very high’ health risk. In the same year, Graz, Rohrbach, Tamsweg, Reutte, Imst, Dornbirn, and Feldkirch only recorded a ‘low’ heat risk index.
According to the study’s definition, the heat stress index is ‘very high’ if there are more than 27.6 hot days per year in the district in question and more than 22.8 per cent of the population is over 65 years old [is this constant over all five years?]. By contrast, the risk is ‘very low’ if there are fewer than 14.9 heat days per year and the proportion of over 65-year-olds is below 18% [now I really need to look at that study to seek answers to my many questions].
The risk index in Vienna is relatively low overall, which the researchers attribute to the low average age of the population. The fact that a higher average age increases the risk can be seen, for example, in the Viennese districts of Innere Stadt [city centre] and Hietzing [think: Manhattan’s Upper West Side] with ‘very high’ exposure.
Green Areas as Compensation
The map shows that, despite rising temperatures, there may also be some cooler years, such as 2020, but the fact that the heat trend is steadily increasing over time is demonstrated by the scientists with an outlook into the future [I’m not a ‘complexity scientist’, but I sure as hell have never heard that one can ‘prove’ a ‘trend over time’—esp. in a ‘complex system’—by extrapolating current trends into the future and calling this ‘proof’], calculated using various emission scenarios.
If greenhouse gas emissions remain as they are at present, almost every district in Austria would be classified as at very high risk by 2050. Even with a strict climate policy, the health risk would remain in the medium to high range, which is partly due to the constantly ageing population [a true Hobson’s choice, if there ever was one…]
In the study, the team also shows that green areas in cities, for example, could significantly reduce the impact of heat on mortality [so, trees reduce death rates? I’d like to see ‘the Science™’ on this one, too]. Local politicians are unlikely to be able to reverse warming or demographic trends, the researchers write in the paper, ‘but they do have the opportunity to create more green spaces in their cities or communities. Such investments are effective because cities can be greened piece by piece without high initial costs’, explained Schuster.
Intermission: What Does ‘the Science™’ Say?
To tell you the truth, dear readers, after this (crappy) news item, my head began to hurt, but since I have so many questions…well, let’s do this and be done with it.
Here’s the linked ‘study’, pending peer-review: entitled, ‘Heat, Health, and Habitats: Analyzing the Intersecting Risks of Climate and Demographic Shifts in Austrian Districts’, authors Hannah Schuster, Axel Polleres, Amin Anjomshoaa, and Johannes Wachs make several claims:
The impact of hot weather on health outcomes of a population is mediated by a variety of factors, including its age profile and local green infrastructure. The combination of warming [variable 1] due to climate change [let’s be generous and conflate into variable 2] and demographic aging [variable 3] suggests that heat-related health outcomes will deteriorate in the coming decades. Here, we measure the relationship between weekly all-cause mortality and heat days in Austrian districts using a panel dataset covering 2015−2022 [but your interactive map shows 2018-23…I don’t understand]. An additional day reaching 30 degrees is associated with a 2.4% increase in mortality per 1000 inhabitants during summer. This association is roughly doubled in districts with a two standard deviation above average share of the population over 65. Using forecasts of hot days (RCP) and demographics in 2050, we observe that districts will have elderly populations and hot days 2−5 standard deviations above the current mean in just 25 years [see: they can ‘observe’ the next 25+ years, although they haven’t happened yet: feel the power of ‘complexity science’]. This predicts a drastic increase in heat-related mortality [oh, are we hedging out bets and words here? how pathetic]. At the same time, district green scores, measured using 10×10 meter resolution satellite images of residential areas, significantly moderate the relationship between heat and mortality. Thus, although local policies likely cannot reverse warming or demographic trends, they can take measures to mediate the health consequences of these growing risks, which are highly heterogeneous across regions, even in Austria.
From the introduction (sigh):
We study the relationship between heat and all-cause mortality in a panel dataset of all Austrian districts. We show that hot days and heat waves predict significantly higher mortality and that districts with older populations are more vulnerable…We use these results plus district-level forecasts of hot weather and population demographics to generate rankings of heat vulnerability of districts in 2050 - finding that even the ‘coolest’ districts today will be more vulnerable in 2050 than the ‘hottest’ districts today. These estimates, plus our findings on greening, give valuable local knowledge to policymakers about this evolving crisis
Remember: this is variable 1 (warming) + variable 2 (ageing population), which is why we desperately need ‘complexity science™’.
Multiple factors including climate change, urbanization [didn’t see that one coming], and demographic aging are driving an emerging heat and health crisis in Europe…
Our paper studies these three features of the emerging heat and health crisis: a heating climate, an aging population, and local differences in the greenness of built environments [so, no urbanisation as variable 4].
Results
We first estimate the relationship between weekly heat days and death rates for Austrian districts using weekly data in summer months from 2015 − 2022 [Q for the statisticians out there: would that 8-year period do in terms of reliable foundation for extrapolations until 2050?]. To do so, we use a highly restrictive fixed effects regression, including district, month-of-year, and year-fixed effects. District fixed effects control for time-invariant features of the district, for instance, its location and altitude. Month-of-year fixed effects control for within-summer heat accumulation, and year-fixed effects control for year-specific shocks, for instance, the intensity of infectious diseases like the flu or COVID-19 in a given year. It is especially important to control for the latter because mortality displacement can confound the effect of heat on mortality. We report these models in Table 1 for several heat variables, including the number of heat days (defined as days with ≥ 30 maximum temperature) in the week, whether there was a heat wave (defined as having three or more heat days), as well as the number of tropical nights (defined as days in which the minimum temperature exceeds 20 degrees). We find that controlling for district, month, and year, the marginal effect of an additional heat day increases the number of deaths per 1000 inhabitants by 0.004 . This is a 2.4% (0.004 /0.169 ) increase over the general average during summer. The effect is nearly additive: the increase in death rates during heatwaves is nearly three times that of a single heat day (0.11 or a 6.5% increase). Finally, tropical nights predict an even greater mortality rate.
Forecasts
So far, we have shown that hot weather predicts higher mortality rates, that elderly people are more vulnerable, and that the density of green vegetation in residential areas may mitigate this effect. We now use forecasts of hot weather and demographics to estimate heat-related health risks in Austria in 2050 [note that neither mitigation efforts nor urbanisation are factored into the model, it seems]. Austria, like many developed countries, is aging rapidly. District-level forecasts also suggest significant warming will increase heat days and heat waves. In Figure 3, we visualize the recent and forecast number of weekly heat days and the current and forecast share of the population of 65 years for all Austrian districts [no need to insert that map: it’s dark-red]. We observe that even the youngest and more temperate districts in Austria in 2050 will resemble a top 20% district in 2022 in terms of heat-age vulnerability. We visualize the shift of each district in the heat-agedness space from 2022 to 2050 in Figure 4. The axis ticks mark the average and standard deviations of both distributions in the 2018−2022 data.
Discussion
Forecasts suggest that by 2050, nearly all Austrian districts will be in the top 20% of heat and age risk of 2022…we also observe that the greenness of the built environment significantly mitigates the relationship between heat and mortality…
Such calculations require more fine-grained and accurate forecasts of both weather and demographic trends. For example, our results are dependent on forecasts of future extreme heat events, which have recently been criticized as underestimates by some, and overestimates by others. Furthermore, it is generally difficult to estimate the effectiveness of green infrastructure projects.
In general, a precise estimate of the social costs of heat on health is beyond the scope of this paper as we only consider the extreme outcome of mortality.
So, now you know: all they considered were ‘the extreme outcome of mortality’. Do you remember reading such cautions in the above news item? Neither do I.
There’s more that’s problematic, and it’s all in the methodology section on/after p. 8 (of 13), including, notably, the absence of urbanisation rates and projections (which is a crucial piece of data); but fear not, the ‘complexity scientists™’ used the following variables (confounders) to make up for this:
District Control Factors
We use different district control factors in our regression model, obtained from different sources and aggregated to the district level if necessary. We use the average gross earnings of employees with full-year earnings from Statistics Austria [Section: Public Finances and Taxes - Subsection: Wage tax statistics—Variable: Employees]. We include this in our data set using a population-weighted mean. The mean altitude was at first calculated for each municipality using the Spartacus data set from Geosphere and aggregated to the district level using a population-weighted mean. Furthermore, we calculated the distance to the closest hospital in, which we also include in this analysis. The initial data set is on the municipality level and is aggregated to the district level using a population-weighted mean.
Lots of averages, means, and big words; I think everyone agrees that average gross earnings of full-time employees is a fair thing to use, but there’s no mention whether this category remains stable (it doesn’t) across time (this year, next year, until 2050), and space (who guarantees such individuals won’t relocate before 2050?). The same applies to the distance to the nearest hospital, which may also shift in the next quarter-century; we note, in passing, that ‘infrastructure’, such as flying cars (kidding) and mountain ranges between said nearest hospital and any given location was apparently omitted.
One last quote and then we’re done:
The weather data is from a Geosphere project called OEKS1545, which uses different modeling approaches to predict yearly heat days on a square km grid and was provided by them directly. We decided to use ‘ICHEC-EC-EARTH_r12i1p1_SMHI-RCA4’, an EC-EARTH global climate model downscaled with the SMHI-RCA4 regional climate model, which is the fourth version of the Rossby Centre Regional Atmospheric Climate Model [RCA4] from the Swedish Meteorological and Hydrological Institute [SMHI]. The dataset is on a km2 level and consists of yearly heat days for different climate scenarios. Since the demographic forecast is available only at the district level, we directly calculated the number of yearly heat days for the two different scenarios at the district level [note the data splicing]. For the prediction of heat days in the near future, we used two different scenarios: the RCP 4.5 [which IPCC report?], which corresponds to the Klimaschutz-Szenario (climate change mitigation scenario), and the RCP 8.5 [lolcatz, see below], which models business-as-usual [sic]. In the near future, both scenarios predict similar outcomes when comparing the results on average, with an increase of 11 summer days and 4.3 heat days.
As to the RCP 8.5 ‘scenario’, well, here’s friend-of-the-WEF and climate scientist™’ Zeke Hausfather on the RCP 8.5 scenario (source):
RCP8.5 was intended to be a ‘very high baseline emission scenario’ representing the 90th percentile of no-policy baseline scenarios available at the time [i.e., it’s very unliekly].
The creators of RCP8.5 had not intended it to represent the most likely ‘business as usual’ outcome, emphasising that ‘no likelihood or preference is attached’ to any of the specific scenarios. Its subsequent use as such represents something of a breakdown in communication between energy systems modellers and the climate modelling community.
About RCP 8.5, well, I recall a chat with none other than Prof. Stefan Rahmstorf, head of the Potsdam Climate Institute, back in 2017 (if memory serves): over lunch—he had some Pacific fish but at least asked if it was fished ‘sustainably’—he mentioned that RCP 8.5 would be irrelevant due to all changes already made. Jus’ sayin’. To be fair, though, none of the ‘complexity scientists™’ were there when I had lunch with Rahmstorf, but I’m quite certain what he shared is no ‘secret’.
Bottom Lines
Sigh.
What else is there to say? You read the news item, I presented snippets from that paper—it’s fear-mongering, and it’s even worse as so many confounders are left out (not even mentioned), with the worst-worst-case ‘scenario’ being hailed as ‘this is going to happen if…’.
People like these have cried ‘wolf’ before, and it’s hard to trust them, esp. with such shoddy papers.
Well, there’s not much more to note, with perhaps the exception of the major funding for Peter Klimek’s Complexity Science Hub being the functional equivalent of 30 pieces of silver for his ‘services’ during the WHO-declared, so-called ‘Pandemic™’.
It’s a lot—vanity, pride, and, of course, corruption come to mind instantaneously—but it ain’t science.
It’s agit-prop of the very crude kind, which comes to the fore in that above-presented ‘map’: approx. 50% of Austrians live in municipalities with less than 10,000 inhabitants, which renders the public policy prescription—building ‘green’ areas—a sad farce. Yes, paving over lots of acreage per year is a problem, but most areas outside the cities are naturally green.
But then again, if these trees were cut down and re-planted, it would ‘save the planet™’ and line some investors’ pockets, too (and, incidentally, some pocket change might also accrue to willing executioners, such as Mr. Klimek and his ilk).
How disgusting.
Science articles on climate reminds me very much of 1980s shampoo-commercials.
"This shampoo restors and repairs your follicles using a special scientific formula tested and developed at several expert institutes in Switzerland"
It was so over-used it became a pre-internet meme here, used whenever you'd make an outrageous bullshit claim - "Trust me bro, this porridge will make you fly, it's been confirmed by severla hyperfictious institutes in Switzerland!".