


How Big is the 'Baby Bust' since 2021?
Official statistics from Norway indicate a mixed bag of goods…

Inspired by cm27874’s recent posting about ‘Births in Germany and Scandinavia’, I decided to go down that particular rabbit-hole to check out how big of an issue the ‘baby bust’ that occurred in close temporal proximity to the Covid modRNA roll-out (figure that)
If you haven’t read CM’s piece, please do so:
So, what we’re going to do is follow CM’s lead as formulated succinctly in his posting:
So what I will do, is to collect the raw data and have a little fun. Germany, Sweden, Norway, Finland and Denmark, the countries dealt with in the two papers, shall be my sample, and 2000-2023 my time frame. Excellent data can easily be found on the pages of the countries’ statistical agencies.
I’ll just double down on his ambition and extend the sample to the entirety of the available data from Statistics Norway, which publishes data on live births going back ‘all the way’ to 1986.
For the source material, please click here (courtesy of Statistics Norway).
In the following, we’ll try to answer two main questions:
How big is the change of live births in Norway broken down by by various age brackets since 1986?
How big is the ‘baby bust’ since 2021 in relation to the available data?
I’ll probably think of a few other issues as we go along, but these two main questions should be kept in mind because, and this is, I think, a valid point to consider in all discussions about demographic decline in recent years:
To what extent are both public health officialdom and we, the people, suffer from what historians conventionally label ‘presentism’? Why is this relevant?
Well, here’s what ‘presentism’ means to Wikipedia (references omitted, here and in the following, emphases mine):
In literary and historical analysis, presentism is a term for the introduction of present-day ideas and perspectives into depictions or interpretations of the past. Some modern historians seek to avoid presentism in their work because they consider it a form of cultural bias, and believe it creates a distorted understanding of their subject matter. The practice of presentism is regarded by some as a common fallacy when writing about the past.
If you wish for a ‘deeper’ (and much, much more scholarly) exploration of ‘presentism’, I’ll refer you to one of my favourite websites of all time, the Stanford Encyclopedia of Philosophy’s entry on ‘Presentism’:
Presentism is the view that only present things exist. So understood, presentism is primarily an ontological doctrine; it’s a view about what exists, absolutely and unrestrictedly.
Let’s not get down too far into these weeds, for the main premise I’ll be exploring in the following is this:
Given the fact that most currently active public health officials and politicians came of age 30-40 years ago (i.e., roughly at the time the Norwegian data starts), their own temporal framework of reference is, essentially, presentist.
Put simply, a currently active public health official or politician is in his or her late 50s or early 60s, hence he or she may not remember correctly what transpired 30-40 years ago.
Hence the hypothesis that the ‘baby bust’ that we’re observing these days (since 2021, at any rate), may be due to such presentist bias.
That said, let’s find out, shall we?
Live Births in Norway, 1986-2023
As per the above-linked data, the essentials may be broken down as follows:
15-19yo: live births declined from 18.2 per 1,000 women in 1986 to 1.4 in 2023, a decline by the factor 13.
20-24yo: live births declined from 93.2 per 1,000 women in 1986 to 22 in 2023, a decline by the factor 4.23.
25-29yo: live births declined from 129.4 per 1,000 women in 1986 to 81.2 in 2023, a decline by the factor 1.59.
30-34yo: live births increased from 74.4 per 1,000 women in 1986 to 108.8 in 2023, an increase by the factor 1.46.
35-39yo: live births increased from 22.2 per 1,000 women in 1986 to 55.6 in 2023, an increase by the factor 2.5.
40-44yo: live births increased from 4.1 per 1,000 women in 1986 to 11.7 in 2023, an increase by the factor 2.85.
45-59yo: live births increased from 0.2 per 1,000 women in 1986 to 1 in 2023, an increase by the factor 5.
If, unlike me, you’re more of the visual type, here’s what these data look like:
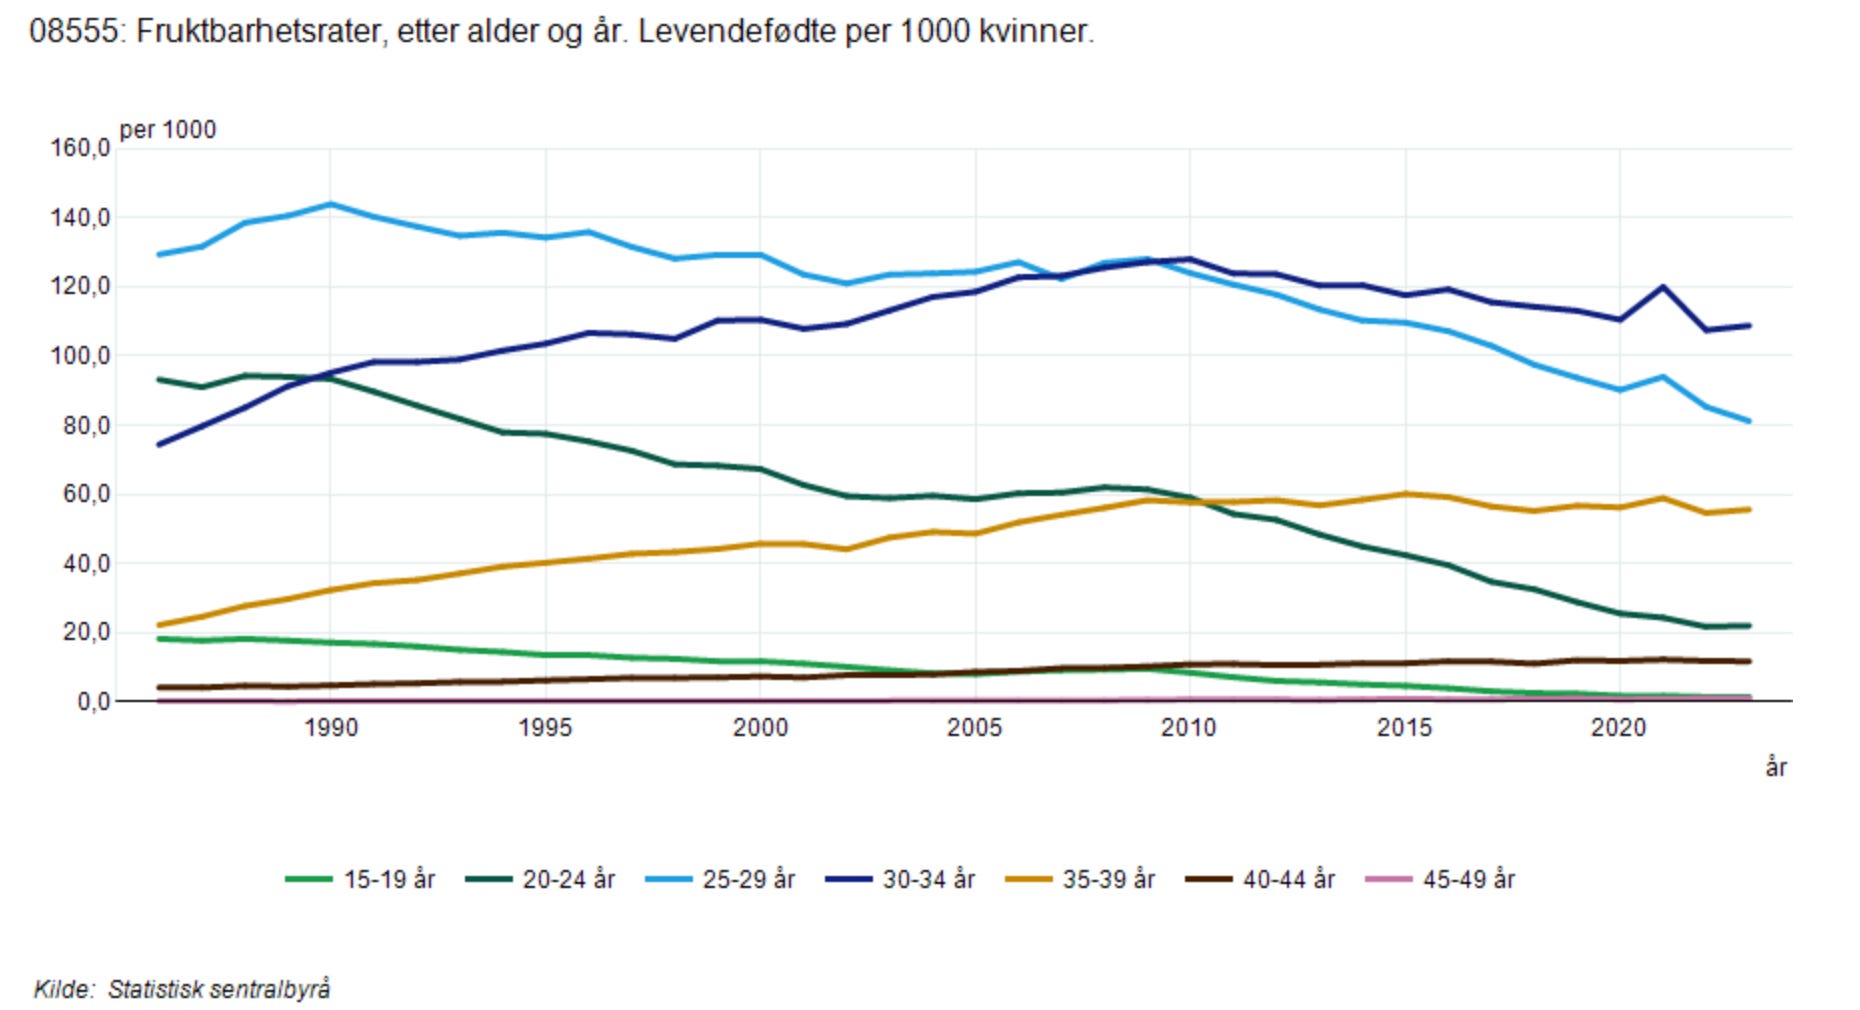
Total fertility rate sorted by age (bracket) and year, no. given are live births per 1,000 women.
Look at the graph, look at the numbers above once more; here’s what I see:
Norway, due to many variables—mostly generous welfare/social policies, rising material conditions of life, I think— has virtually eliminated teenage pregnancies since the mid-1980s.
Basically, what has happened is that fertility in the age brackets 20-24 and 25-29 has been overtaken by fertility in the age brackets 30-34 and 35-39, respectively.
There’s a noticeable shift by about ten years: 30-34yo women overtook 20-24yo mothers around 1990, sometime between 2005-10 the 30-34yo overtook ‘even’ 25-29yo. In other words: 30-34 is the new 20-24 in terms of motherhood.
This third point, then, leads us to another question:
What About the Age of the Parents at the Birth of the First Child?
Luckily, to answer this question, Statistics Norway offers even longer data series, going back all the way to 1961 (source):
A mother’s age at the birth of her first child in 1961 was 24.6 years, a father’s age was 28.2 years.
By 2023, these have increased to 30.3 (mothers) and 32.3 (fathers), respectively, an increase of 5.7 and 4.1 years, respectively.
Average age of parents at the birth of their first child; light green = mothers, dark green = fathers.
So, what’s the impact, then?
How Big is the ‘Baby Bust’ Since 2021?
Well, this is a tricky and contentious issue, isn’t it? So, here we go:

Expressed in one way, we get the following declines (in percent) from 1986-90:
15-19yo: -2.74%
20-24yo: +0.21%
25-29yo: +8.65%
30-34yo: +22.71%
35-39yo: +24.77%
40-44yo: +7.31%
45-49yo: -50%
If, by way of comparison, we now do the same math for the period 2019-2023, we’ll get the following percentage changes:
15-19yo: -39.13%
20-24yo: -23.61%
25-29yo: -13.34%
30-34yo: -3.8%
35-39yo: -1.94%
40-44yo: -2.5%
45-49yo: +11.11%
Given that the age brackets of 25-29 and 30-34 are the cohorts who bear most children these days, the results are…well, quite interesting and hard to interpret. The most obvious—and biggest—declines in live births per 1,000 women occurred among teenage girls and women in their early twenties.
Expressed visually, this is what it looks like:
There is a dramatic decrease in live births among the three younger age brackets, with the decline among 20-24yo being the most pronounced, followed closely by their 25-29yo peers.
What Does this All Mean?
I don’t know, and I’m happy to read your views.
From these data, I think the decline in live births per 1,000 women is dramatic in some of the younger age brackets while it is hard to see or non-existent in the older age brackets.
This can be explained, I think, at least partially, by long-established social and educational patterns that have much to do with social/welfare legislation as opposed to the modRNA injections.
Now, I’m not discounting that these gene therapy products had an effect—which is clearly visible in all-cause mortality, which I’ve taken from this source over at Statistics Norway (1961-2023):
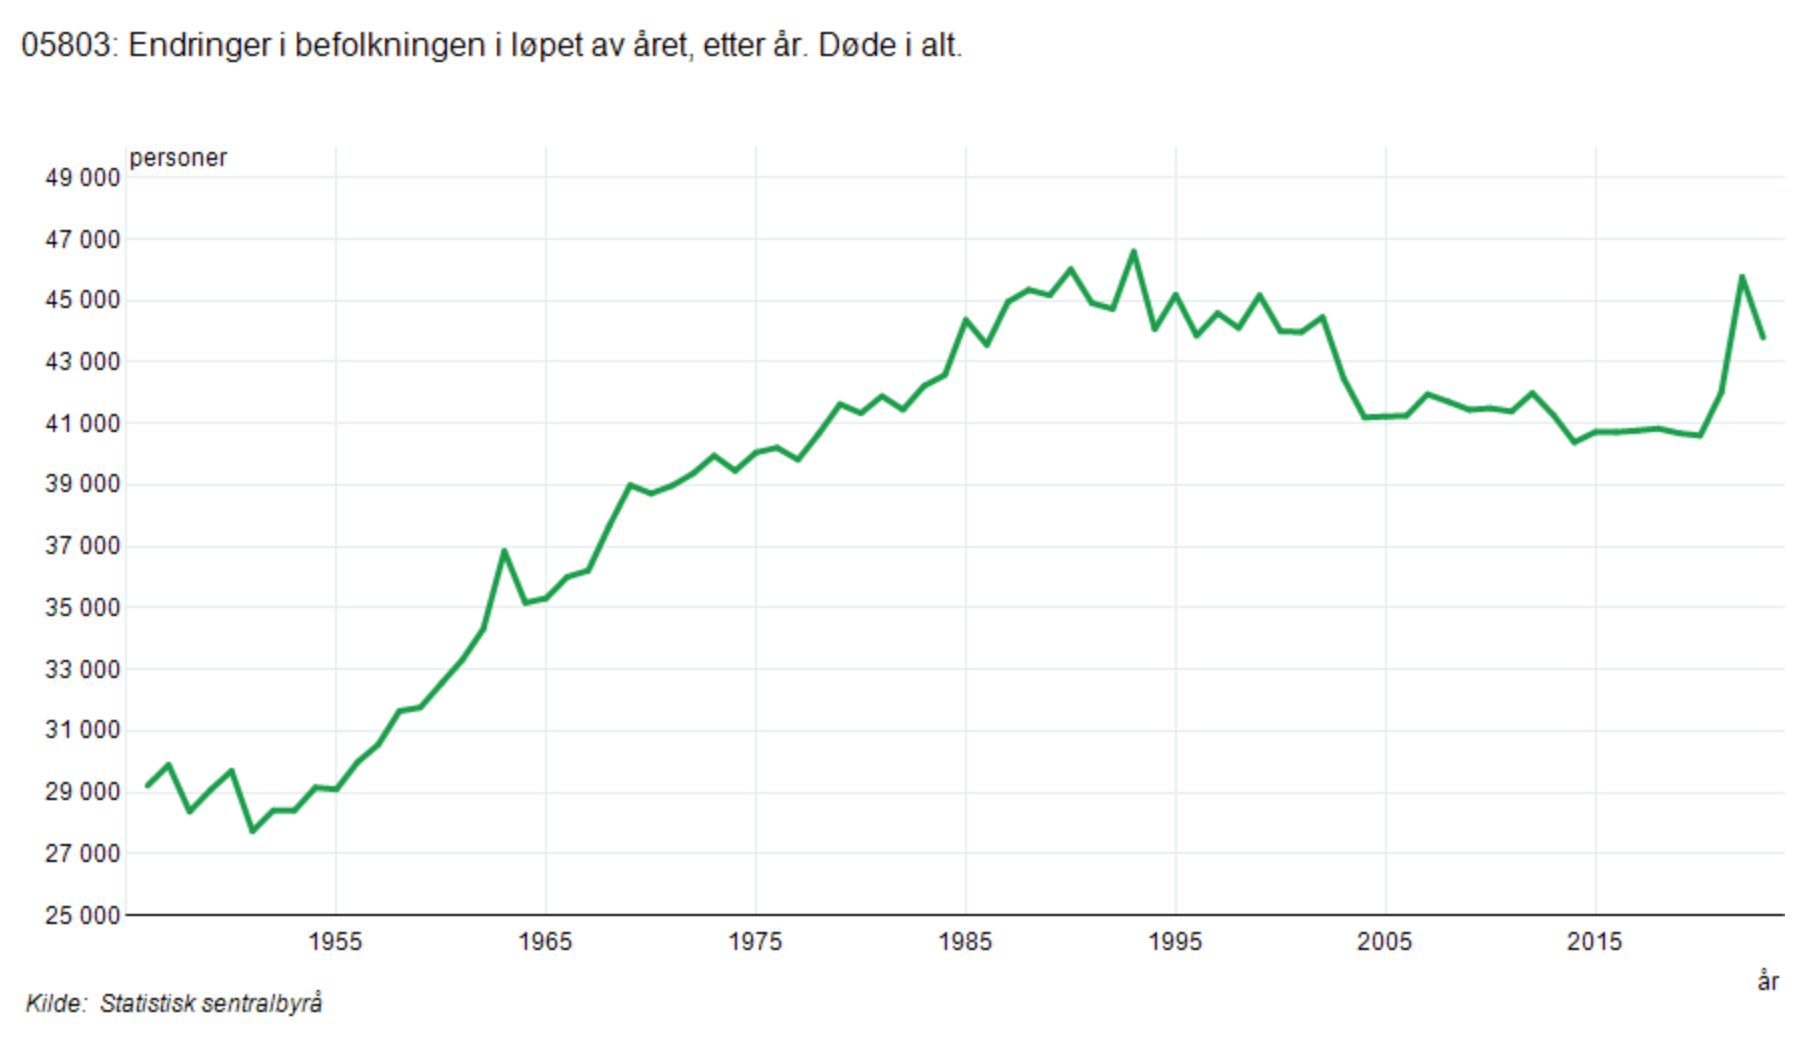
That spike on the far-right side of the image is 2022, and it’s quite outside the trend line. I’ve written about this at-length in these pages, e.g.,


There’s comparatively little on the issue of the ‘baby bust’ since 2021, perhaps because the influx of many Ukrainians and other refugees permits the authorities to paper over these problems for the time being.
Sooner or later, however, everyone sits down at a banquet of consequences.
What these might be, well, you guess is as good as mine.