


Strawberry Fields Forever
Due to 'warm weather', the strawberry harvest in Lower Austria commenced 'as early as never before'

Today’s brief update from the frontiers of ‘the Climate Catastrophe™’ comes via Austrian state broadcaster ORF’s Lower Austrian state affiliate. It is also an update on the instalment earlier this year on bountiful asparagus harvests:

As always, translation, emphases, and bottom lines mine.
Strawberry Harvest as Early as Never Before
By Anna-Marleen Marchetti, ORF Niederösterreich, 11 May 2024 [source]
The Lower Austrian strawberry harvest has started a good week and a half earlier this year. According to experts, the early start is due to the early summer temperatures of the last few weeks. The conditions so far suggest a good yield.
Strawberries prefer temperatures between 20 and 25 degrees Celsius. Despite a cold snap in April with some very cold nights, strawberry farmer Lukas Lehner from Haag (Amstetten district) is no longer worried about his strawberries:
They are developing really well at the moment. I don’t think it will cool down again like it did recently. We now always have warm nights with eleven to twelve degrees and that’s good for the development of the strawberries because they continue to ripen.
However, due to the very early start, it could also be over earlier this year, explains Lehner during a site visit by noe.ORF.at [no, they apparently don’t have anything else to report on]: ‘The season probably won’t last until the end of June either. So if you want to pick your own, for example, it’s best to do so in the next few weeks.’ The harvest period would normally last around four weeks. [no good thing—earlier strawberries—goes unpunished: instead of late May, it’s mid-May this year…]
Self-Picking and Processing is the Trend
There is great interest in the strawberry harvest at the strawberry field in Haag. More and more people want to pick and bake their own strawberries again. The first visitors really enjoyed the sweet, red fruits: ‘I would say it's an experience with friends and also a regional product. You really know where the fruit comes from’, one woman told noe.ORF.at.
Some also took the opportunity to combine the visit to the strawberry field with something else and prepare a gift for Mother’s Day: ‘We're making a Mother's Day cake for Sunday with the fresh strawberries.’
Bottom Lines
According to Austrian ‘Climate Watchdog’ four-letter agency ZAMG, this is what the air temperature looked like in the weeks before the above piece appeared:

The image shows the surface temperature and states that ambient air temperatures were, on average, 3.1 degrees warmer than the reference period 1961-90.
Here is what the monthly ‘weather report’ for April 2024 says:
Overall balance: too warm, too wet and average solar yield
April 2024 was 1.2 °C warmer than the average for the 1991 to 2020 climate period in Austria's lowlands and 1.8 °C warmer in the mountains. This puts Austria’s lowlands in 12th place in the series of the warmest April months in the 258-year measurement history and the mountains in 10th place in the 174-year mountain measurement series [sorry, folks, no records this time]. Compared to the 1961-1990 climate period [lol], April 2024 was 2.8 °C above average in the lowlands and 3.4 °C above average in the mountains. The amount of precipitation in April 2024 was 10 % above the long-term average. At 2 % above average, the number of hours of sunshine was almost exactly in line with the long-term average.
Extremely early flowering and frost damage
The very warm start to spring meant that the plants developed around two to four weeks earlier. The start of flowering of lilacs (80 years in the measurement series), apples (84 years) and pears (64 years) was even the earliest in the respective measurement series. The cold snap in mid-April significantly slowed down phenological development and caused massive frost damage to vines and fruit crops in some regions.
All in all, a mixed bag of goods, it would seem.
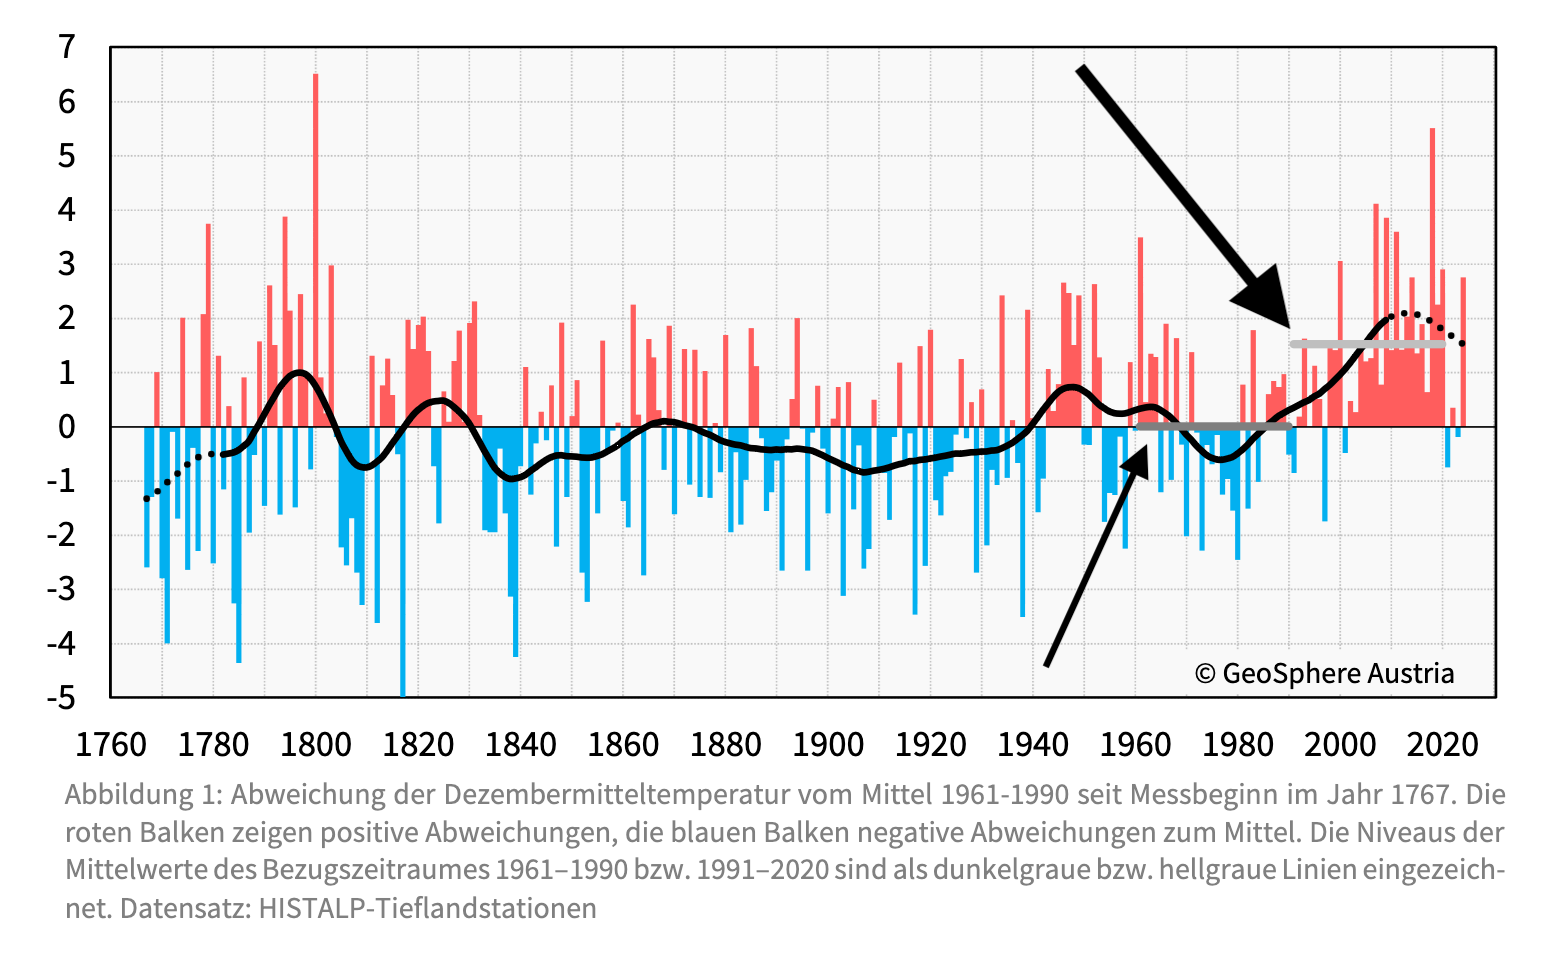
By the way, look at the accompanying graph (same source), which shows the ‘deviation of average December temperatures from the average of the reference period 1961-90 since measurements began in 1767’. My black arrows point to the light grey bar indicating the average for the reference period 1991-2000 and the dark grey bar—which sits exactly at the 0 degree line—shows the reference period 1961-90, respectively.
Looks bad, right? Right!
Do you notice something…fishy?
First of all, WTF is a ‘deviation of averages from averages’? Does it really mean something, anything?
Second, why use a diachronic comparison of December temps in April?
Third, leaving aside one or more data splices involved in the reconstruction of ‘historical’ temperature data, we note, in passing, the fact that there are many more standardised measurement instruments and stations than in the 1760s (or anytime in-between).
Yet, did you notice that the ‘average 1961-90’ is ± at the 0 degree line? Look again—the meandering black line indicates the moving average—and it does look like ‘the period’ before 1961 was mostly colder than it is now. Note that the black line is given as dots in the very early years of measurement in the late 18th century.
The world was coming out of the so-called ‘Little Ice Age’, which indicates that it was colder before the late 18th century—and warmer before the ‘Little Ice Age’. This is called the ‘Mediaeval Warm Period’ (MWP) and it lasted from about 950-1250.
According to the ‘Ministry of Truth’ (Wikipedia), this is what caused the MWP (references omitted, emphases mine):
Possible causes of the MWP include increased solar activity, decreased volcanic activity, and changes in ocean circulation. Modelling evidence has shown that natural variability is insufficient on its own to explain the MWP and that an external forcing [?] had to be one of the causes.
While the MWP is also sometimes called an ‘anomaly’, models (sic) show that it may have been due to the sun, the earth-moon system (volcanoes), or ocean currents.
But today’s temperatures are definitely caused by human-made CO2 emissions (which correspond to some 20-5% of all CO2 in the atmosphere), right? No chance anything else could be responsible, isn’t it? After all, the warmer MWP must have been caused by something other than, say, the universe. If I had to guess, that’s probably due to ‘models’ being unable to explain it. Or because if something else is the cause, then it also means something—whatever—for the present moment.
What’s in a Word (Data Splice)?
Speaking of the present moment once more, we’ll conclude here mentioning that the data set in the above ‘December averages of averages’ graph is based on a specific sub-set of temperature data called HISTALP.
According to the ZAMG’s dedicated website, this data set consists
of monthly homogenised temperature, pressure, precipitation, sunshine and cloudiness records for the ‘Greater Alpine Region’ (GAR, 4-19 deg E, 43-49 deg N, 0-3500m asl). The longest temperature and air pressure series extend back to 1760, precipitation to 1800, cloudiness to the 1840s and sunshine to the 1880s.
So, data splice writ large is what the reconstruction is all about, yet this isn’t all that’s highly problematic in terms of epistemology. Just look at this screen shot from the HISTALP website:

‘Different climate anomalies…reduce each other when averaged’. Well, we may also note that this ‘disclaimer’ (of sorts) is notably absent from the above April report graph. We may now ‘wonder’ why, eh?
Moreover, using a subset of data (HISTALP Lowlands)—which I was unable to find concrete definitions of in terms of which stations were used to compute it—there is no way of knowing. Go ahead, click on that link and see if you can find it (website’s in English). One has to ‘trust the Science™’ on this one, too, I suppose.
The more I did into that website, the more questions I have. I shall update you ‘soon’ on them.
For now—enjoy the bountiful strawberries, I suppose, courtesy of ‘the Climate Crisis™’, right? RIGHT!
Strawberry in swedish: jordgubbe. Jord = earth Gubbe = old man (geezer). Why are they named that? No-one knows.
Me, I prefer raspberries.